Mobile Home Park Investing: Why the Economics Look Nothing Like Other Real Estate
A mobile home park investor owns the land, roads, and utility infrastructure but usually not the homes themselves. Tenants own their homes and pay lot rent. Turnover cost is near zero because the tenant takes the home when they leave. Five strategies fit the category: lot-rent-only, POH-to-TOH conversion, value-add turnaround, infill and expansion, and affordable workforce housing.
An apartment investor buys a building. The building has 80 units. The investor owns every wall, every roof, every appliance, every square foot of flooring inside those 80 units. When a dishwasher breaks, the investor pays. When a roof leaks, the investor pays. When a tenant moves out, the investor repaints, replaces carpet, and spends $2,000-$5,000 turning the unit before the next tenant moves in.
A mobile home park investor buys a property with 80 pads. The investor owns the land, the roads, the water lines, and the electrical infrastructure. The investor does not own a single home. The tenants own their homes. When a dishwasher breaks, the tenant pays. When a roof leaks, the tenant pays. When a tenant moves out, the tenant either sells their home to the next occupant or moves it. The investor's turnover cost is zero.
That is not a minor structural difference. That is a completely different business model operating inside the same asset class label.
Who This Is For
If you own a mobile home park, are evaluating one for acquisition, or are trying to understand why manufactured housing communities have attracted billions in institutional capital over the past decade, this post breaks down five strategies investors use to enter and operate these assets, what each looks like with real numbers, and why the economic structure is genuinely different from everything covered so far in this series.
This is Part 7 of a 16-week series covering every major real estate asset class. Part 1 covered single family homes. Part 2 covered duplexes, triplexes, and fourplexes. Part 3 covered small apartment buildings in the 5-25 unit range. Part 4 covered large apartment complexes at 25+ units. Part 5 covered commercial real estate including office, retail, and industrial. Part 6 covered self-storage investing.
| Part | Asset Class |
|---|---|
| 1 | Single Family Homes |
| 2 | Duplexes, Triplexes, Fourplexes |
| 3 | Small Apartments (5-25 Units) |
| 4 | Large Apartments (25+ Units) |
| 5 | Commercial RE: Office, Retail, Industrial |
| 6 | Self-Storage Facilities |
| 7 | Mobile Home Parks (You Are Here) |
| 8 | Raw Land (Next Week) |
The Problem: You Own the Dirt, Not the Building. That Changes Everything.
Every asset class covered in Parts 1 through 6 shared one assumption: the investor owns the structure. Whether it was a single family rental, a 200-unit apartment complex, or a 400-unit self-storage facility, the investor owned the building, maintained it, improved it, and depreciated it. The building was the asset.
Mobile home parks break that assumption.
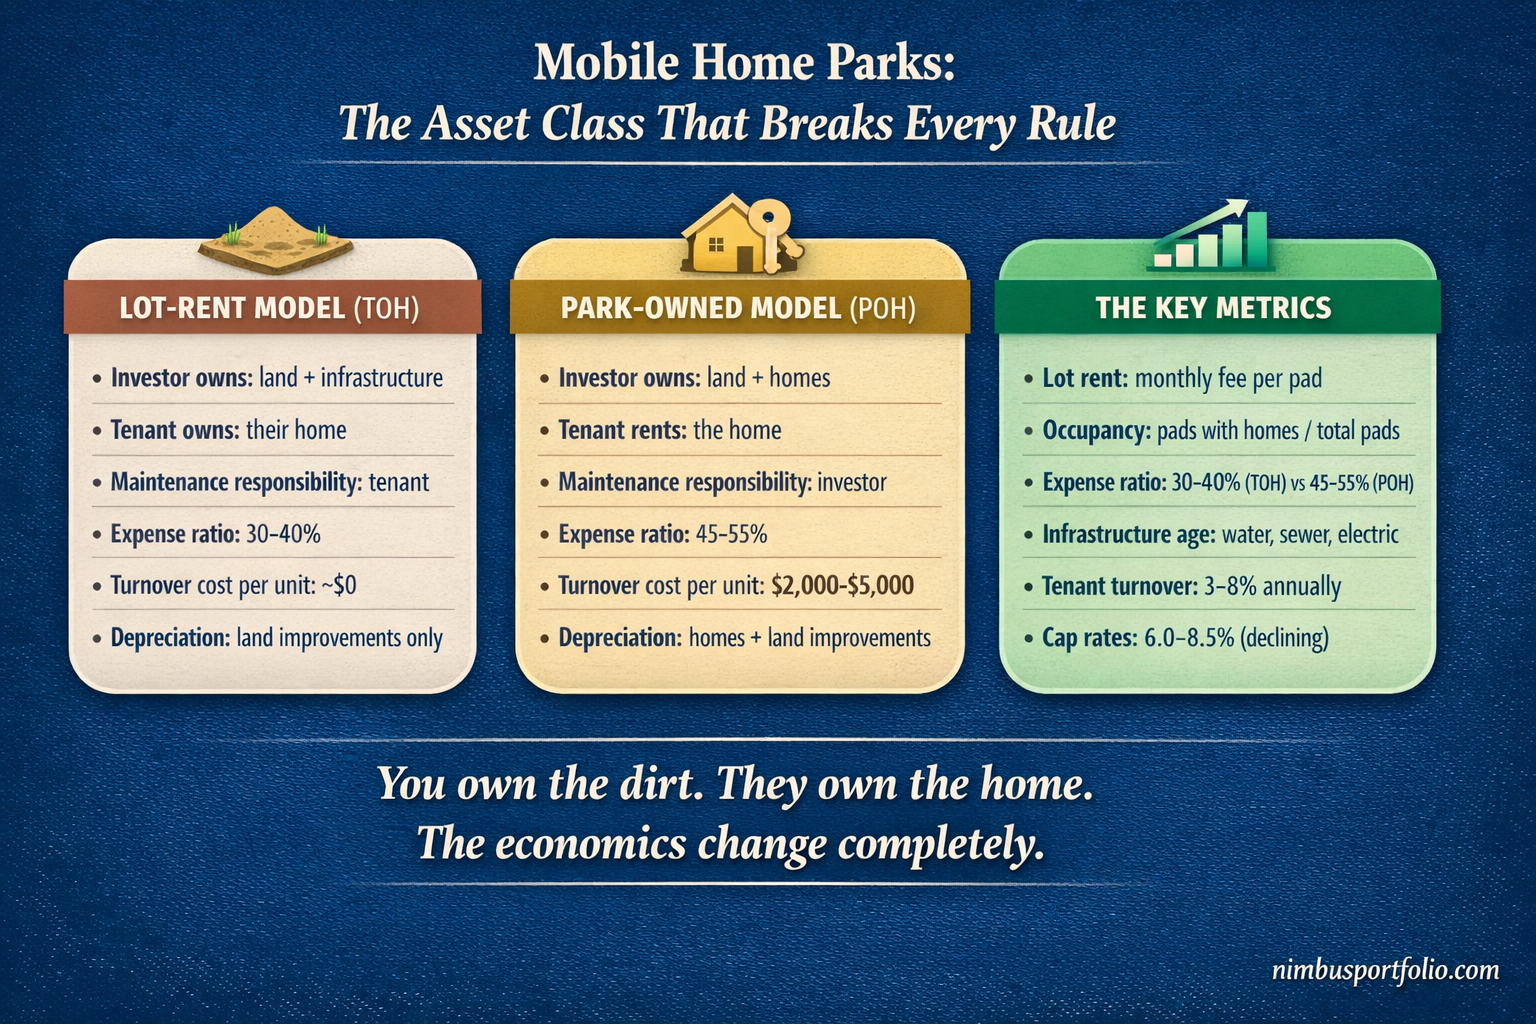
In the most common and most desirable ownership structure, a lot-rent-only park, the investor owns the land and the infrastructure beneath it: roads, water lines, sewer systems, electrical pedestals, and common areas. The tenants own their homes. The investor collects a monthly lot rent for the right to place a home on the pad. That is the entire revenue model.
The maintenance equation inverts. In an apartment building, the landlord is responsible for everything inside and outside the units. In a lot-rent park, the landlord is responsible for the infrastructure and common areas. The tenant is responsible for their home. Roof repairs, HVAC replacement, plumbing inside the home, appliances — all tenant responsibility. This is why lot-rent-only parks run expense ratios of 30-40%, compared to 45-55% for residential multifamily and 35-50% for park-owned home communities.
Vacancy works differently. In an apartment, a vacant unit can be filled in 2-4 weeks with marketing, cleaning, and a lease signing. In a mobile home park, a vacant pad with no home on it cannot be rented. You need a home on the pad. Bringing in a new manufactured home costs $50,000-$80,000 delivered and set up. Bringing in a used home costs $15,000-$30,000 plus $5,000-$10,000 for transport and setup. Filling a vacant pad is a capital investment, not an operating expense. This fundamentally changes how you think about occupancy.
Tenant retention is structurally higher than any other asset class. Moving a manufactured home costs $5,000-$10,000 or more. Most tenants cannot afford to move their home, and many homes are too old to survive the move. Annual turnover in well-run parks runs 3-8%, compared to 40-60% in apartment buildings and near-100% monthly churn in self-storage. When a tenant is paying $350/month in lot rent and would need $8,000 to relocate, the economic friction keeps them in place. This is why lot rent increases, even aggressive ones, rarely trigger mass departures. It also means operators have an ethical obligation to be responsible with pricing — these are people's homes.
New supply is virtually nonexistent. Try getting a new mobile home park approved in any municipality in the country. Zoning boards do not approve new manufactured housing communities. NIMBY opposition is fierce. Environmental review requirements are extensive. The result: the total number of mobile home parks in the United States has been declining for decades as parks are redeveloped into higher-density uses. Every park that closes makes the remaining parks more valuable. This supply constraint is the single most important structural advantage of the asset class.
Strategy 1: Lot-Rent-Only Acquisition (Tenant-Owned Homes)
What it is: Buying an existing mobile home park where all or nearly all homes are owned by the tenants. The investor owns the land and infrastructure, collects monthly lot rent from each occupied pad, and has no responsibility for the homes themselves. This is the purest form of mobile home park ownership and the structure most sophisticated investors prefer because of its low expense ratio, minimal maintenance burden, and predictable cash flow.
Real example: An 80-pad manufactured housing community in central Indiana, 45 minutes outside Indianapolis. All 80 pads have tenant-owned homes. Current lot rent: $325/month per pad. Physical occupancy: 92% (74 of 80 pads occupied with homes, 6 pads vacant but with homes that need to be sold or removed). Gross potential revenue at full occupancy: $312,000/year. Actual collected revenue at 92% occupancy: $288,600/year.
Operating expenses: on-site manager part-time ($28,000), property taxes ($18,000), insurance ($9,500), water and sewer ($22,000 — the park has a private water system and municipal sewer connection), road maintenance and snow removal ($8,000), mowing and common area upkeep ($6,500), legal and accounting ($4,000), miscellaneous repairs to infrastructure ($5,000). Total operating expenses: $101,000. NOI: $187,600. Expense ratio: 35.0%.
Purchase price at a 7.0% cap rate: $2,680,000. Financed with a commercial loan at 6.5% fixed for 7 years, 25-year amortization, 25% down ($670,000). Annual debt service: approximately $155,000. Annual cash flow after debt service: approximately $32,600. Cash-on-cash return: 4.9%.
That cash-on-cash looks modest. Here is why lot-rent-only parks still attract buyers at these prices. First, lot rents in many markets are still well below what the market can support. A park charging $325/month in a market where comparable parks charge $400/month has $75/month per pad of embedded rent growth. On 74 occupied pads, that is $66,600/year of additional NOI available through annual rent increases of $25-$50/pad over 2-3 years without adding a single tenant. Second, the supply constraint matters. No new parks are being built. The total inventory of manufactured housing communities is shrinking. Every park that gets rezoned and redeveloped makes the remaining parks more valuable.
Lot rent vs. apartment rent: A lot rent of $325/month sounds cheap compared to a $1,200/month apartment rent. But the economics per dollar of revenue are dramatically different. The lot-rent investor has no building maintenance, no appliance replacement, no unit turnover costs, and no capital expenditure on the homes. The apartment investor spends $200-$400/month per unit on maintenance, turnover, and reserves. The lot-rent investor's $325 in revenue produces $210 of NOI. The apartment investor's $1,200 in revenue produces $540-$660 of NOI. The lot-rent investor's margin percentage is higher even though the absolute revenue is lower.
The private utility question: Many older mobile home parks operate private water systems (wells) and private sewer systems (septic fields or package treatment plants). These are the single largest risk factor in lot-rent-only acquisitions. A private well that fails or a septic system that needs replacement can cost $200,000-$500,000 or more. Before acquiring any park, an environmental Phase I assessment and a utility infrastructure inspection are non-negotiable. The age and condition of underground water and sewer lines determine whether you are buying a cash-flowing asset or a ticking infrastructure liability.
Metrics that matter:
- Lot rent relative to market. Are you below, at, or above comparable parks within 15 miles? Below-market lot rent is embedded upside.
- Occupancy by pad status: pads with homes (occupied), pads with homes (vacant home), pads without homes (empty lots). Each requires different capital to fill.
- Infrastructure age and type. Municipal water/sewer is preferred. Private systems require reserves and ongoing compliance costs.
- Expense ratio. Below 35% for a lot-rent-only park is well-managed. Above 40% deserves investigation.
- DSCR at acquisition. Lenders typically require 1.20-1.30x for manufactured housing communities.
- Tenant tenure. Average years in place is a retention signal. Longer tenure means more stable cash flow.
Management intensity: Low to moderate. A lot-rent-only park with municipal utilities, paved roads, and enforced community rules requires minimal day-to-day management. An on-site or on-call manager handles rent collection, rule enforcement, and vendor coordination. The investor's primary responsibilities are capital planning, rent increase strategy, and monitoring infrastructure condition. Parks with private utilities require more active oversight.
Best for: First-time mobile home park investors, 1031 exchange buyers looking for stable cash flow with lower management intensity than apartments, and investors seeking an asset class with structural supply protection and embedded rent growth. The lot-rent-only model is the closest thing in real estate to owning a toll road: you own the infrastructure, someone else uses it, and the cost of leaving is high enough that usage stays stable.
Strategy 2: Park-Owned Home (POH) to Tenant-Owned Home (TOH) Conversion
What it is: Buying a mobile home park where some or all of the homes are owned by the park (park-owned homes, or POHs), then selling those homes to the tenants through rent-to-own agreements or outright sales, converting the park from a POH model to a lot-rent-only model. This strategy transforms a high-expense, management-intensive operation into a low-expense infrastructure business while generating home sale revenue during the conversion period.
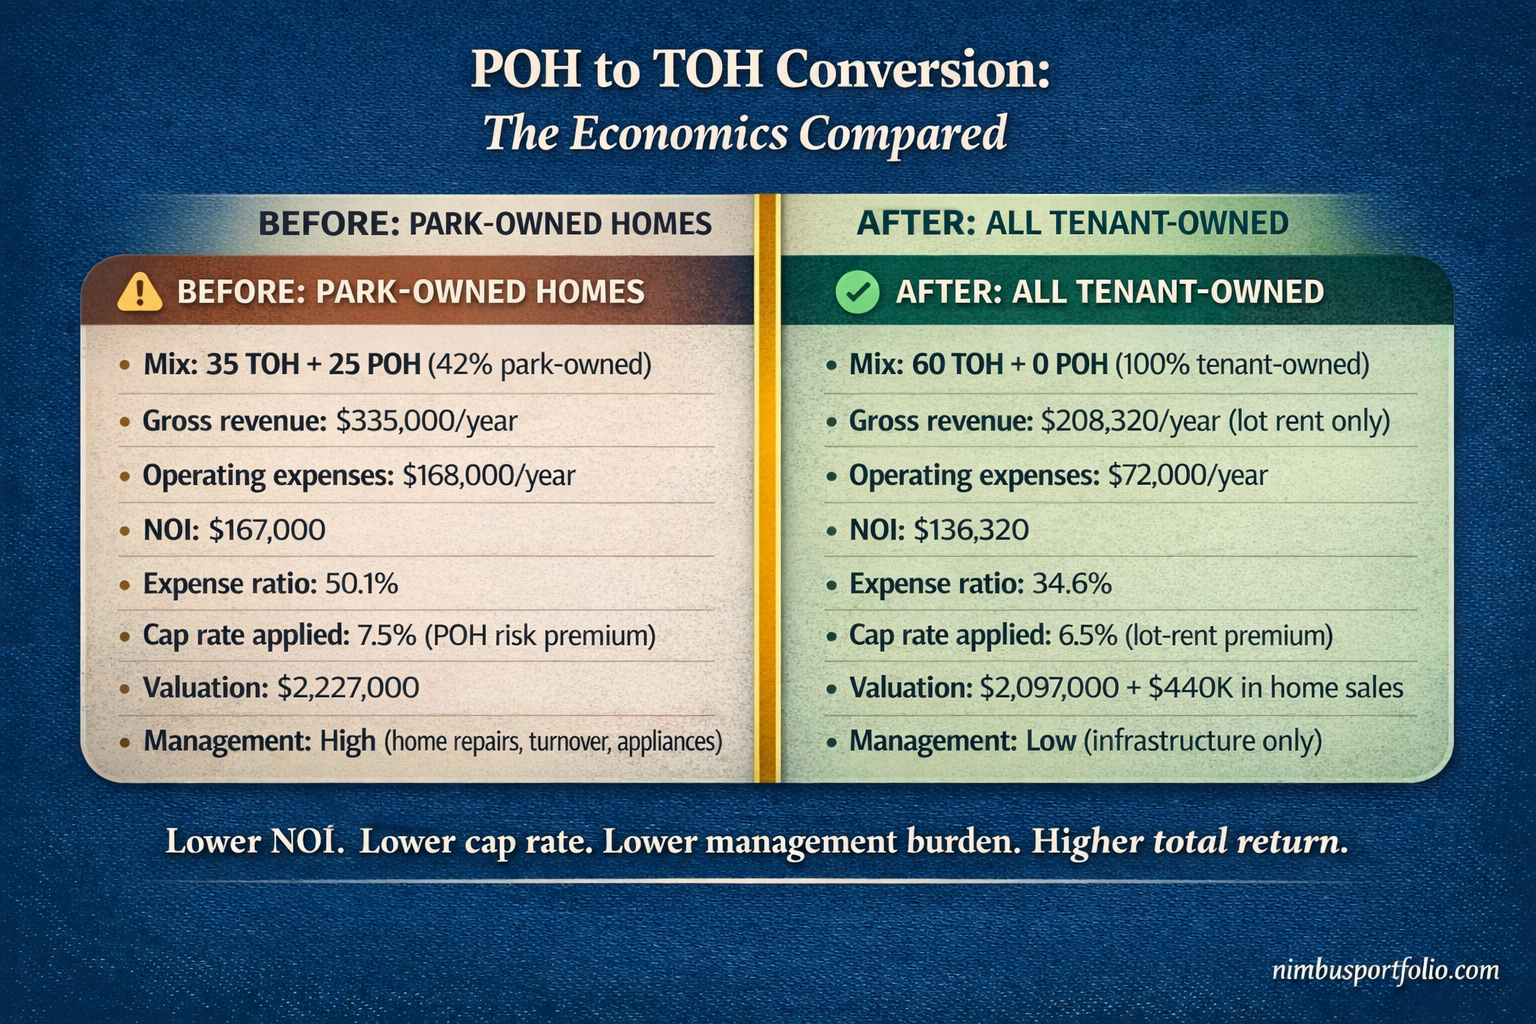
Real example: A 60-pad manufactured housing community in northern Alabama, 30 minutes outside Huntsville. Current mix: 35 tenant-owned homes and 25 park-owned homes. Lot rent for TOH pads: $285/month. Rent for POH units (lot rent plus home rent): $650/month. Physical occupancy: 88% (53 of 60 pads occupied). Current gross revenue: $335,000/year. Current operating expenses including POH maintenance, turnover, and home insurance: $168,000. Current NOI: $167,000. Expense ratio: 50.1%.
Purchase price at a 7.5% cap rate on current POH-heavy NOI: $2,227,000. The seller accepts a cap rate that reflects the management burden and expense structure of maintaining 25 park-owned homes.
Conversion plan: sell the 25 POH units to existing tenants or new buyers through rent-to-own agreements. Sale price per home: $18,000-$28,000 depending on age, size, and condition. Terms: $2,000 down payment, $350/month for 60 months at 8% interest (these are chattel loans on the homes, not mortgages on real property). As each home sells, the tenant transitions from paying $650/month in combined rent to paying $285/month in lot rent plus $350/month on their home loan. The investor loses $650/month in POH rental income and gains $285/month in lot rent plus the home sale proceeds.
Over 18-24 months, 20 of the 25 POH units are sold. Home sale revenue: approximately $440,000 (20 homes at an average of $22,000). The remaining 5 homes are too old to sell and are replaced with new units at $55,000 each ($275,000 total investment), then sold on rent-to-own terms at $38,000 each.
Post-conversion financial picture: 60 pads, all tenant-owned homes. Lot rent increased to $310/month during conversion (market was $285 at acquisition, now $310 after 2 years of modest increases). Occupancy: 93% (56 pads). Gross revenue: $208,320/year in lot rent. Operating expenses without POH maintenance burden: $72,000. NOI: $136,320. Expense ratio: 34.6%.
Wait — the NOI went down. From $167,000 to $136,320. Why would anyone do this?
Because the value changed. At acquisition, the park was valued at a 7.5% cap rate reflecting POH risk and management burden. Post-conversion, the park is a lot-rent-only community valued at a 6.5% cap rate. New value: $136,320 / 0.065 = $2,097,000. Add the home sale proceeds received during conversion ($440,000 in rent-to-own notes, of which approximately $320,000 has been collected in the first 18-24 months). Add the remaining note receivables. The total return on the initial $557,000 down payment includes both the property value and the home sale income stream.
More importantly, the ongoing management burden dropped dramatically. No more 2 AM calls about broken furnaces in POH units. No more $3,000 turnover costs when a POH tenant leaves. No more appliance replacement budgets. The investor converted a management-intensive rental operation into a passive infrastructure business.
The rent-to-own mechanics: Selling homes via rent-to-own (also called lease-purchase or contract for deed) means the tenant makes monthly payments toward ownership. The investor retains title to the home until it is paid off. If the tenant defaults, the investor takes back the home and re-sells it. This creates a second income stream during conversion and gives tenants a path to homeownership — which increases their investment in maintaining the property and reduces community management friction.
Metrics that matter:
- POH percentage at acquisition. Higher POH percentage means more conversion opportunity but also more execution risk and capital required.
- Home condition assessment. Homes older than 1976 (pre-HUD code) may not be worth selling and need to be replaced.
- Market lot rent. Post-conversion value depends entirely on lot rent levels. Higher lot rents produce higher post-conversion NOI and value.
- Home sale pricing relative to replacement cost. If you can sell a POH for $22,000 that would cost $55,000 to replace, the buyer is getting a deal and you are converting an expense liability into cash.
- Expense ratio spread. The gap between POH expense ratio (45-55%) and TOH expense ratio (30-40%) is the margin improvement you are buying.
- Leverage position post-conversion. Lower NOI but a tighter cap rate means the equity position may actually improve.
Management intensity: High during the conversion period. Coordinating home sales, managing rent-to-own agreements, handling home replacements, and navigating tenant transitions all require active involvement. Post-conversion, management intensity drops to the same level as a lot-rent-only acquisition.
Best for: Investors with operational experience or a strong property management partner who can execute the conversion while maintaining community stability. The POH-to-TOH conversion is one of the highest-returning strategies in manufactured housing, but it requires patience, capital for home replacements, and the ability to manage a multi-year transition without disrupting occupancy.
Strategy 3: Value-Add Turnaround
What it is: Buying a mismanaged or neglected mobile home park, improving the infrastructure and operations, raising rents to market levels, enforcing community rules, and increasing occupancy. This is the most common strategy among experienced MHP operators because thousands of parks across the country are still run by aging owners who have deferred maintenance, kept rents flat for years, and allowed community standards to deteriorate. The gap between current performance and achievable performance under competent management is the investment thesis.
Real example: A 100-pad manufactured housing community in east Texas, 90 minutes from Dallas. Current owner has operated the park for 28 years and is retiring. Current lot rent: $225/month — market comparable parks within 20 miles charge $325-$375/month. Physical occupancy: 78% (78 occupied pads, 12 pads with abandoned homes, 10 vacant pads with no homes). Current gross revenue: $210,600/year. Operating expenses are artificially low because maintenance has been deferred: $82,000/year. Current NOI: $128,600.
The problems are visible on the first site visit. Roads are unpaved gravel with potholes. Three streetlights are broken. The community sign is faded and leaning. Twelve abandoned homes sit on pads — some have been vacant for 3+ years. The park's water system is a private well serving all 100 pads through aging PVC and galvanized lines. No sub-metering on water; the owner pays the entire water bill. Five tenants are more than 60 days delinquent and have not received formal notices.
Purchase price: $1,650,000 at an effective cap rate of 7.8% on current NOI. The seller's asking price was higher, but the deferred maintenance and below-market rents justify the discount.
Year 1 turnaround plan ($185,000 capital budget):
- Remove 12 abandoned homes (cost: $3,000-$5,000 per home for demolition and disposal = $48,000)
- Pave main roads ($55,000)
- Repair streetlights and install community signage ($8,000)
- Install water sub-meters on all occupied pads ($35,000 for 78 meters at $450 each)
- Legal costs for formal eviction of chronic non-paying tenants ($6,000)
- Begin lot rent increases: $25/month increase every 6 months, starting 90 days after acquisition
- General infrastructure repairs ($33,000)
Year 1 results: Lot rent moves from $225 to $275/month. Two non-paying tenants are evicted and replaced. Occupancy holds at 78% (the rent increase does not trigger departures because moving a home costs $5,000-$10,000 and comparable parks charge $325+). Water sub-metering passes $18,000/year in water costs to tenants, reducing operating expenses. New gross revenue: $257,400/year. New operating expenses including increased maintenance spending: $95,000. New NOI: $162,400.
Year 2-3: Continue rent increases to $325/month (market level). Bring in 6 new manufactured homes on vacant pads at $55,000 each ($330,000 investment), selling them to tenants via rent-to-own. Occupancy reaches 90%. At $325/month lot rent on 90 occupied pads: gross revenue of $351,000/year. Stabilized operating expenses: $126,000. Stabilized NOI: $225,000. Expense ratio: 35.9%.
Stabilized value at a 6.5% cap rate: $3,461,000. Total investment: $1,650,000 purchase + $185,000 Year 1 improvements + $330,000 infill homes = $2,165,000. Plus home sale revenue from rent-to-own notes. Equity multiple on the investment: approximately 1.6x before accounting for cash flow during the hold period and home sale proceeds.
The rent increase conversation: Raising lot rents from $225 to $325 over 2-3 years is a 44% cumulative increase. This is where the ethics of MHP investing become real. These are people's homes. They cannot easily move. Responsible operators raise rents in predictable increments ($25-$50 every 6-12 months), provide advance written notice (typically 60-90 days), and invest the additional revenue visibly in community improvements. Tenants who see paved roads, working streetlights, and a clean community are more likely to accept rent increases than tenants who see rising costs with no visible improvements. The operators who raise rents aggressively while investing nothing in the community are the ones generating negative media coverage of the industry. Do not be that operator.
The abandoned home problem: Nearly every value-add park has abandoned homes — units left behind by tenants who stopped paying and disappeared. These homes sit on revenue-producing pads, generating no income and creating blight. Removing them requires following state-specific lien and abandonment procedures, which typically take 60-120 days. The demolition and disposal cost is $3,000-$5,000 per home. Once the home is removed, the pad becomes available for infill. Clearing abandoned homes is the first step in any turnaround and produces immediate visual improvement.
Metrics that matter:
- Current lot rent vs. market lot rent. The spread is the embedded revenue opportunity.
- Deferred maintenance backlog. Get a full infrastructure inspection before closing. Water and sewer system age is the single largest variable.
- Abandoned home count. Each one represents a pad that is producing zero revenue and costing money.
- Delinquency rate. High delinquency in an MHP usually signals lax management, not tenant inability to pay. Formal notice procedures typically resolve most delinquency within 60 days.
- Cash-on-cash return at current NOI vs. projected stabilized NOI. The spread is the value-add thesis in a single number.
- Water and sewer system type. Municipal connections are lower risk. Private wells and septic systems carry infrastructure replacement risk.
Management intensity: High during the turnaround phase (12-24 months). Clearing abandoned homes, managing construction, implementing sub-metering, enforcing rules, processing evictions, and executing rent increases all require active daily involvement from the owner or a capable property manager. Post-stabilization, intensity drops significantly, especially in lot-rent-only parks with municipal utilities.
Best for: Experienced operators or investors with a strong operating partner who can execute a multi-phase turnaround plan while maintaining community stability. The value-add MHP strategy has produced some of the strongest risk-adjusted returns in all of real estate over the past decade, precisely because the supply of mismanaged parks is large and the operational improvements are well-understood.
Strategy 4: Infill and Expansion
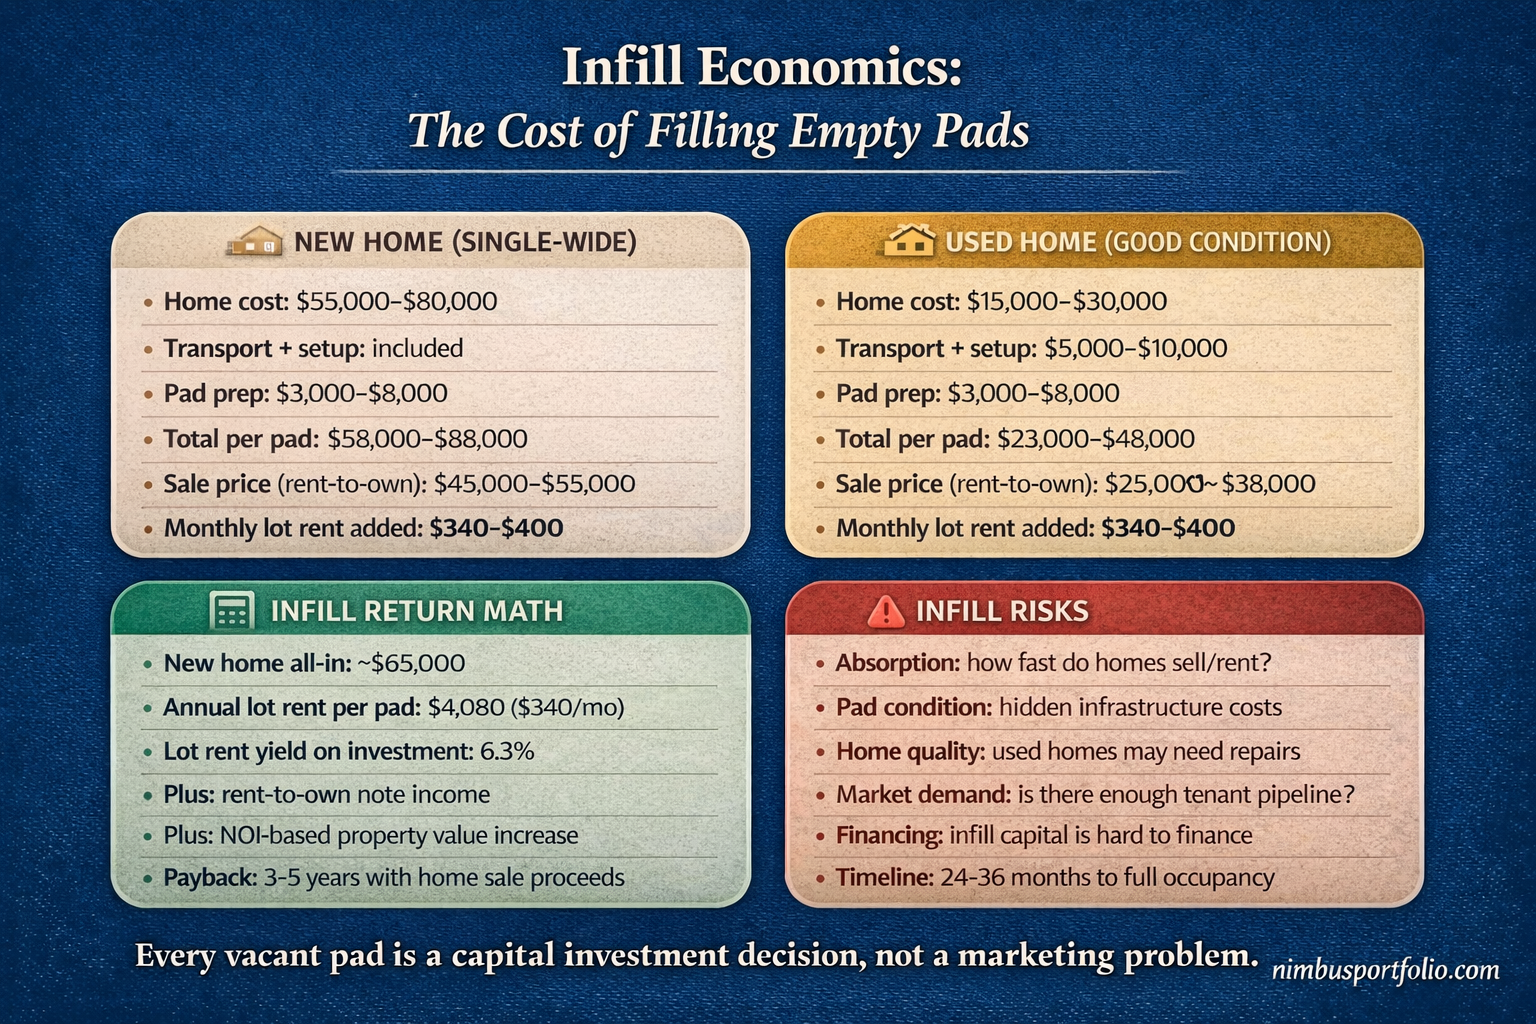
What it is: Buying a mobile home park with a significant number of vacant pads, then purchasing and placing new or used manufactured homes on those pads to increase occupancy and revenue. Unlike apartment investing, where a vacant unit just needs cleaning and marketing, a vacant MHP pad with no home on it requires a capital investment of $50,000-$80,000 per new home (or $20,000-$40,000 for a quality used home including transport and setup). Infill is a development play disguised as an acquisition.
Real example: A 120-pad manufactured housing community in the Piedmont region of North Carolina, 40 minutes from Charlotte. Current occupancy: 67% (80 occupied pads with tenant-owned homes, 8 pads with park-owned homes, 32 vacant pads with no homes). Current lot rent: $340/month. POH rent: $725/month. Current gross revenue: $395,600/year. Operating expenses: $162,000. Current NOI: $233,600. Expense ratio: 41% (elevated by the POH units).
Purchase price: $3,120,000 at a 7.5% cap rate on current NOI, reflecting the below-stabilized occupancy.
Infill plan: Place new manufactured homes on 24 of the 32 vacant pads over 24-30 months (hold 8 pads in reserve for future demand). New single-wide manufactured homes delivered and set up: $62,000 per home. Total infill capital: $1,488,000 for 24 homes.
Home disposition strategy: Sell all 24 new homes to tenants via rent-to-own at $45,000-$52,000 per home (below replacement cost, making them attractive to buyers). Terms: $3,000 down, $425/month for 84 months at 9% interest. As each home sells, the tenant pays lot rent ($340/month) plus their home loan payment ($425/month). The investor collects lot rent in perpetuity and home sale proceeds over the note term.
Simultaneously convert the 8 existing POH units to TOH following the Strategy 2 playbook.
Post-infill financial picture (Month 30): 120 pads, 112 occupied (93% occupancy), all tenant-owned homes. Lot rent increased to $365/month during the infill period. Gross lot rent revenue: $490,560/year. Operating expenses for a fully TOH park: $172,000. NOI: $318,560. Expense ratio: 35.1%.
Post-infill value at a 6.0% cap rate (Charlotte metro proximity commands a tighter cap): $5,309,000. Total investment: $3,120,000 purchase + $1,488,000 infill homes = $4,608,000. Plus cumulative home sale revenue and rent-to-own note income. Equity created: approximately $700,000 in property value appreciation plus ongoing home sale cash flow.
The home sourcing decision: New manufactured homes from factories like Clayton, Cavco, or Skyline cost $55,000-$80,000 for a single-wide (3 bed/2 bath, approximately 1,100 sq ft) delivered and set up in 2026. Used homes in good condition cost $15,000-$30,000 to purchase and $5,000-$10,000 to transport and set up. New homes attract better tenants, command higher sale prices, and have lower maintenance needs. Used homes cost less but carry higher repair risk and may not meet current HUD standards. Most infill operators use a mix: new homes for the best pads and used homes where budget constraints require it.
Pad preparation costs: A vacant pad is not always ready to receive a home. Older parks may have outdated electrical pedestals (30-amp service when modern homes need 200-amp), deteriorated water and sewer connections, or pad surfaces that need grading. Budget $3,000-$8,000 per pad for preparation before the home arrives. In parks with aging infrastructure, this cost can be higher. Always inspect pad-level utility connections before committing to infill counts.
Metrics that matter:
- Vacant pad count and pad condition. Each vacant pad is a capital deployment opportunity, but only if the infrastructure supports a new home.
- Infill cost per pad (home + transport + setup + pad prep). This is your all-in investment per additional revenue unit.
- Absorption rate. How quickly can you place and sell/rent homes in this market? Research comparable parks' recent occupancy trends.
- Lot rent per pad. Higher lot rents justify higher infill costs because the yield on each placed home is proportionally higher.
- Return on equity on infill capital. Calculate the incremental NOI generated by each filled pad against the capital required to fill it.
- Infrastructure capacity. Can the water, sewer, and electrical systems support 40 additional homes? If not, the expansion requires infrastructure capital first.
Management intensity: High during the infill phase. Coordinating home purchases, managing deliveries and setup, preparing pads, marketing homes to prospective tenants, and processing rent-to-own agreements all require active project management. The infill phase is effectively a real estate development project within an operating community. Post-infill, management intensity drops to the level of a standard lot-rent-only park.
Best for: Investors with development experience or a relationship with manufactured home dealers who can source and place homes efficiently. Infill is capital-intensive but produces both immediate lot-rent revenue and long-term property value appreciation as each filled pad increases NOI and reduces the effective cap rate. This strategy works best in markets with strong demand for affordable housing and limited alternative supply.
Strategy 5: Affordable Housing and Workforce Housing Partnership
What it is: Operating a mobile home park as purpose-driven affordable or workforce housing, often in partnership with government programs (Section 8 Housing Choice Vouchers, USDA Rural Development, state housing finance agencies) or community organizations. This strategy focuses on providing quality housing at below-market rates while maintaining stable returns through government-backed rent payments, tax incentives, and lower vacancy risk. It is the strategy with the strongest social impact alignment and, for the right operator, competitive financial returns.
Real example: A 75-pad manufactured housing community in rural Ohio, 20 minutes from a regional distribution center that employs 1,200 workers. The area has a severe shortage of affordable housing — the nearest apartment complex has a 6-month waitlist. Current park condition: functional but dated. 65 occupied pads, 10 vacant (5 with homes, 5 without). Current lot rent: $275/month. Current gross revenue: $214,500/year. Operating expenses: $85,000. Current NOI: $129,500.
Purchase price: $1,725,000 at a 7.5% cap rate. The seller is a retiring owner who has operated the park for 22 years.
Workforce housing strategy: Partner with the distribution center's HR department to offer housing as an employee benefit pipeline. The employer does not subsidize rent directly, but promotes the community to new hires and transferring employees. This creates a consistent tenant pipeline and reduces marketing costs to near zero. Fill 5 vacant pads with used homes at $28,000 each ($140,000 total), selling them to distribution center employees via rent-to-own.
Section 8 integration: Accept Housing Choice Voucher tenants for lot rent. In this market, the local housing authority's Fair Market Rent for a manufactured home pad is $310/month. Current lot rent is $275. By accepting vouchers and setting lot rent at $300/month, the investor receives reliable government-backed payments for voucher tenants. Section 8 tenants typically have extremely low turnover because losing their voucher means losing their housing subsidy — the economic incentive to remain in place is enormous.
Post-stabilization (Month 18): 75 pads, 72 occupied (96% occupancy). Mix: 25 voucher-holding tenants (government-backed rent), 30 distribution center employees, 17 general market tenants. Lot rent: $300/month. Gross revenue: $259,200/year. Operating expenses: $95,000 (slightly higher due to compliance and reporting requirements for voucher tenants). NOI: $164,200. Expense ratio: 36.7%.
Stabilized value at a 7.0% cap rate: $2,346,000. The cap rate is slightly wider than a pure market-rate park because of the affordable housing focus, but the occupancy stability and government-backed income offset the cap rate difference. Total equity created: $621,000 on a $431,000 down payment plus $140,000 in infill capital. Plus the community impact: 72 families with stable, affordable housing in a market that desperately needs it.
The social responsibility dimension: Approximately 22 million Americans live in manufactured housing. For many, it is the only path to homeownership at a price point they can afford. Mobile home park investors who raise lot rents responsibly, maintain community infrastructure, and treat tenants with dignity are providing a critical housing function. Investors who buy parks, slash services, and raise rents aggressively to maximize short-term returns are the ones generating legislative backlash and rent control proposals in states like Colorado, Oregon, and New York. The workforce housing strategy explicitly aligns financial returns with social impact. It is not philanthropy. It is a business model that produces competitive returns while serving a population that has limited alternatives.
Government program mechanics: Housing Choice Vouchers (Section 8) pay the difference between 30% of the tenant's income and the Fair Market Rent established by the local housing authority. For a lot-rent-only park, the voucher covers part or all of the lot rent. USDA Rural Development Section 515 and 514/516 programs provide financing for rural affordable housing, including manufactured housing communities. State housing finance agencies in some states offer property tax abatements or reduced financing rates for communities that maintain affordability commitments. These programs require compliance with income verification, property inspections, and reporting requirements — which adds administrative cost but provides income stability.
Metrics that matter:
- Local Fair Market Rent for manufactured housing pads. This sets the ceiling for Section 8 lot rent payments.
- Area median income (AMI) and affordability gap. A market with high housing costs and limited supply is the strongest environment for affordable MHP operations.
- Employer partnerships within commuting distance. Distribution centers, manufacturing plants, hospitals, and military bases all create consistent tenant demand.
- Voucher wait time. Long housing authority waitlists signal strong demand for affordable options.
- Compliance costs. Budget 3-5% of gross revenue for the administrative burden of government housing programs.
- DSCR with government-backed income. Lenders view voucher income favorably because payment reliability exceeds market tenants.
Management intensity: Moderate. The tenant pipeline is largely self-generating through employer partnerships and housing authority referrals, reducing marketing effort. However, Section 8 compliance requires annual inspections, income recertification paperwork, and coordination with the local housing authority. A property manager experienced with government housing programs is essential. Day-to-day operations are comparable to a standard lot-rent-only park.
Best for: Investors who want financial returns alongside measurable social impact, investors in rural or workforce-heavy markets where affordable housing demand exceeds supply, and operators willing to navigate government program compliance in exchange for income stability and near-zero vacancy. This strategy does not sacrifice returns for mission. In the right market, it produces returns comparable to or better than market-rate parks because of the occupancy stability and employer-backed tenant pipeline.
Why the Numbers Work Differently in Mobile Home Parks
Parts 1 through 6 built a progression from residential to commercial to specialty assets. Mobile home parks sit in a category that borrows from all three but matches none of them.
The expense ratio advantage is structural, not operational. In a lot-rent-only park, the investor has no building maintenance, no appliance budgets, no unit turnover costs, and no tenant improvement allowances. The only expenses are infrastructure maintenance (roads, water, sewer, electrical), property taxes, insurance, management, and common area upkeep. This produces expense ratios of 30-40% — comparable to self-storage and significantly lower than apartments (45-55%) or POH communities (45-55%). The difference is not because MHP operators are better managers. It is because the business model structurally eliminates the largest expense categories in traditional rental real estate.
Tenant retention reduces every cost. Annual turnover in a well-run MHP runs 3-8%. In a 100-pad park, that means 3-8 tenants leave per year. In a 100-unit apartment building, 40-60 tenants leave per year. Each apartment turnover costs $2,000-$5,000 in cleaning, painting, repairs, and vacancy loss. Each MHP departure costs the investor nearly nothing if the departing tenant sells their home to the next occupant. The math compounds: lower turnover means lower vacancy loss, lower marketing costs, lower administrative burden, and more predictable cash flow. The structural friction of moving a manufactured home ($5,000-$10,000+) is the mechanism that produces this retention advantage.
The supply constraint is permanent. In every other asset class covered in this series, new supply is a competitive risk. Apartment developers build new complexes. Self-storage developers add new facilities. Commercial builders construct new office and retail. In manufactured housing, new park development has effectively stopped. Municipal zoning boards do not approve new mobile home park developments. The NIMBY opposition is too strong, the environmental review too onerous, and the political cost too high. The total number of MHP communities in the United States has declined from approximately 50,000 in the early 2000s to approximately 43,000 today. Every park that gets rezoned and redeveloped into a subdivision or commercial development reduces supply permanently. This supply constraint means existing park owners face less competitive pressure than owners of any other commercial asset class. It also means the remaining parks become incrementally more valuable each year as demand for affordable housing continues to grow.
Financing is the biggest friction point. Traditional residential lenders do not finance mobile home parks. Commercial banks will finance parks with 50+ pads and strong financials, but at commercial terms: 25-30% down, 5-10 year fixed terms with 25-year amortization, and DSCR requirements of 1.20-1.35x. Fannie Mae and Freddie Mac have manufactured housing community lending programs, but they require 50+ pads, professional management, and strong occupancy. Parks with fewer than 50 pads rely on local banks, seller financing, or specialty lenders like 21st Mortgage. The limited financing options create both a barrier to entry and an opportunity: parks that cannot attract institutional financing trade at higher cap rates, creating value for buyers who can source creative financing.
The terminology matters. The industry uses "manufactured housing community" rather than "mobile home park" or "trailer park." Homes built after June 15, 1976, are governed by the HUD Manufactured Housing Construction and Safety Standards and are properly called "manufactured homes." Homes built before that date were built to varying state standards and are called "mobile homes." The distinction matters for financing (lenders prefer post-1976 HUD code homes), insurance (rates differ by construction standard), and resale value. A park full of post-1976 HUD code homes is a materially different asset than a park full of pre-1976 mobile homes, even if they sit on the same type of pads.
How Nimbus Handles This
A manufactured housing community does not fit into a residential property tracker, and it does not fit into a generic commercial real estate template designed for office buildings and retail centers. The metrics that matter for MHP investors, lot rent per pad, occupancy, tenant-owned vs. park-owned home mix, expense ratios, and tenant retention, are specific to the asset class.
Nimbus Portfolio tracks manufactured housing communities as a dedicated asset type. You can log total pads, occupied pads, average pad rent, tenant-owned home percentage, park-owned home count, monthly rent roll, and operating expenses. The platform calculates occupancy rate, NOI, cap rate, cash-on-cash return, and revenue per pad from those inputs. Monthly valuation snapshots track how your community's estimated value changes over time.
The portfolio view is where this matters most for diversified investors. If you own a duplex, a self-storage facility, and an 80-pad manufactured housing community, Nimbus rolls all three into a single dashboard: total portfolio value, total equity, total monthly cash flow, and asset allocation by type. No separate spreadsheets. No manual aggregation. See how a mixed portfolio looks from a single view.
Scenario modeling lets you stress test your MHP alongside the rest of your portfolio. Run a hold vs. sell analysis as cap rates shift, or model what an acquisition looks like before you close. The buy scenario tool, DSCR calculator, and cash-on-cash calculator are all free and require no account.
What Comes Next in This Series
This is Part 7 of a 16-week series. Next up: raw land. Every asset class covered so far has had a building, a structure, or at minimum an infrastructure system that produces income. Raw land has none of those things. There is no NOI. There is no cash flow. There is no tenant. The entire return thesis is based on appreciation, entitlement, and the optionality of what the land could become. That changes every valuation framework we have built so far. That is what Part 8 covers.
Start Tracking Your Manufactured Housing Community the Way Its Performance Demands
An 80-pad manufactured housing community is not an apartment building with cheaper units. It is an infrastructure business whose value responds to lot rent levels, occupancy by pad status, and the structural advantage of owning an asset class where new supply cannot be built. Tracking it alongside your residential properties in a spreadsheet that was designed for rental income and mortgage payments means losing visibility into the metrics that actually drive the value.
Add your first property in under two minutes and see your numbers the way they actually work. Get started at Nimbus Portfolio
Nimbus Portfolio tracks 19+ real estate asset types and categories. Free tier available. Portfolio plan at $24/month or $190/year. Portfolio+ at $49/month or $390/year.
Frequently asked questions
What is the difference between POH and TOH in mobile home parks?
POH stands for park-owned home: the investor owns the home and rents it to the tenant, who pays a higher combined rent. TOH stands for tenant-owned home: the tenant owns the home and pays lot rent only. Most experienced operators prefer TOH because it shifts maintenance and turnover cost to the tenant.
How risky is water and sewer infrastructure in a mobile home park?
Private water, sewer, or septic systems are one of the largest risk factors. A failed sewer line can cost six figures to repair. Many operators require a Phase II environmental assessment and an infrastructure inspection during diligence, and some refuse to buy parks with private sewage entirely.
What is lot rent and how does it differ from apartment rent?
Lot rent is the monthly fee a mobile home owner pays for the right to occupy a pad, plus access to park infrastructure and amenities. It does not include the home itself. Lot rent is typically a fraction of apartment rent in the same market, but net operating margin is often higher because tenants handle their own home maintenance.
Why have institutions bought so many mobile home parks?
Mobile home parks offer defensive cash flow, low turnover cost, sticky tenants (moving a home can cost several thousand dollars), and limited new supply because most jurisdictions will not permit new parks. Institutions also see the sector as undermanaged, with rent levels well below free-market clearing prices in many markets.