One House, Eight Strategies: Why the Way You Use a Single Family Home Matters More Than the Home Itself
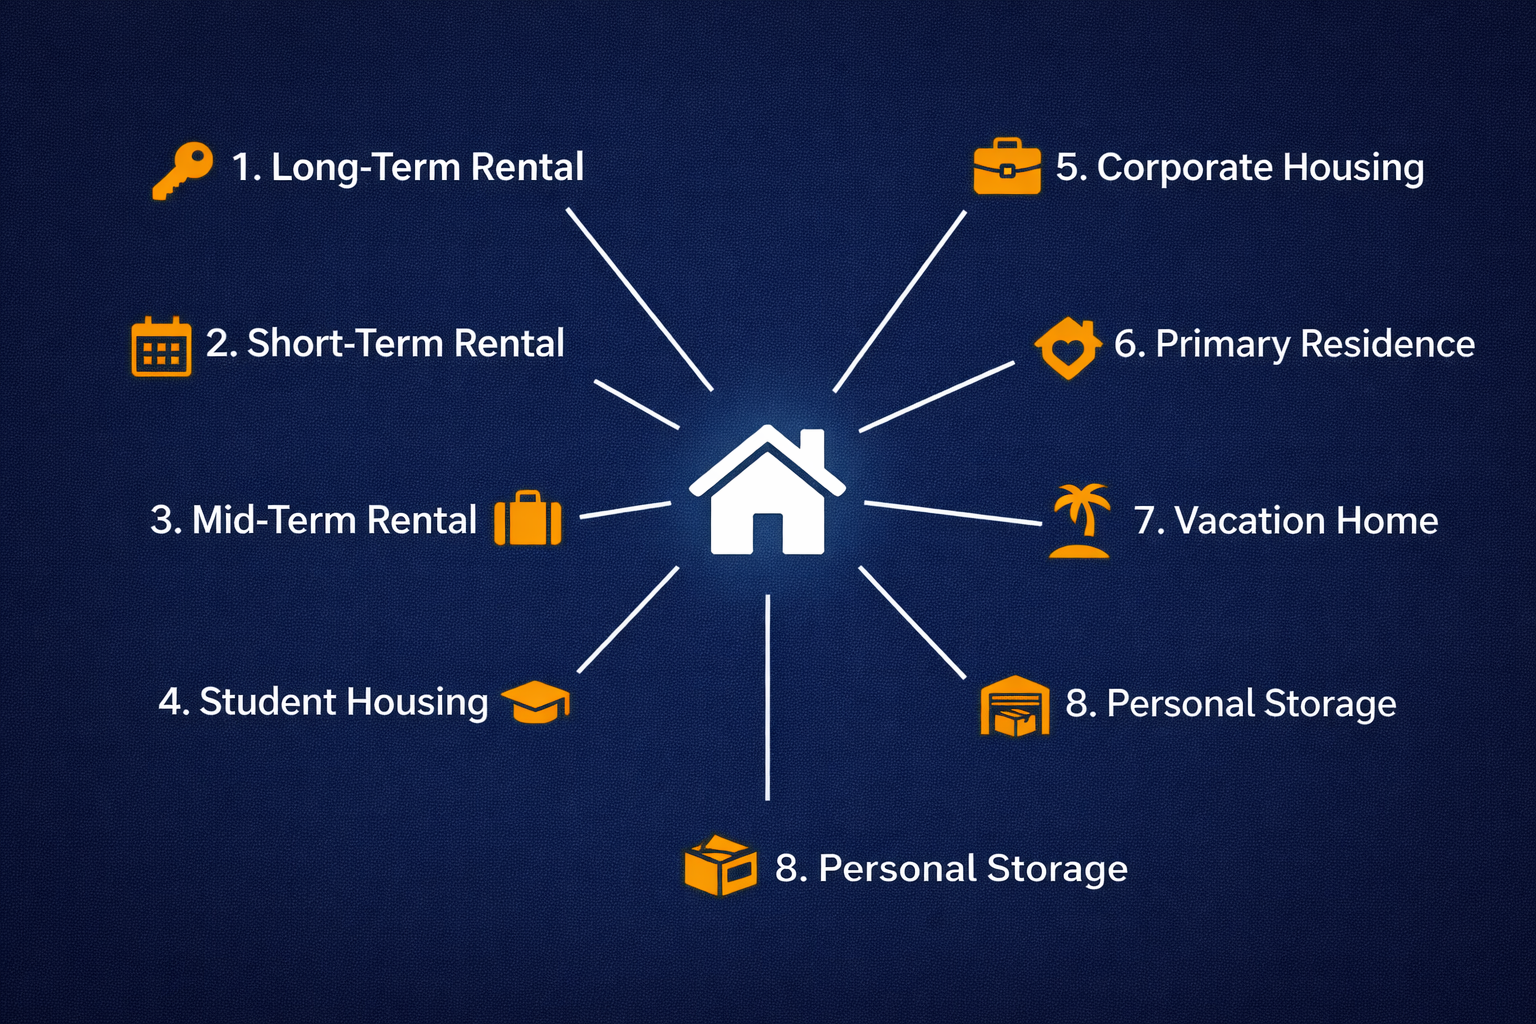
A single family home can be run as a long-term rental, short-term rental, mid-term rental, student housing, corporate housing, primary residence, vacation home, or personal storage. Each strategy produces different income, requires different management, and is taxed differently, even though the house is the same.
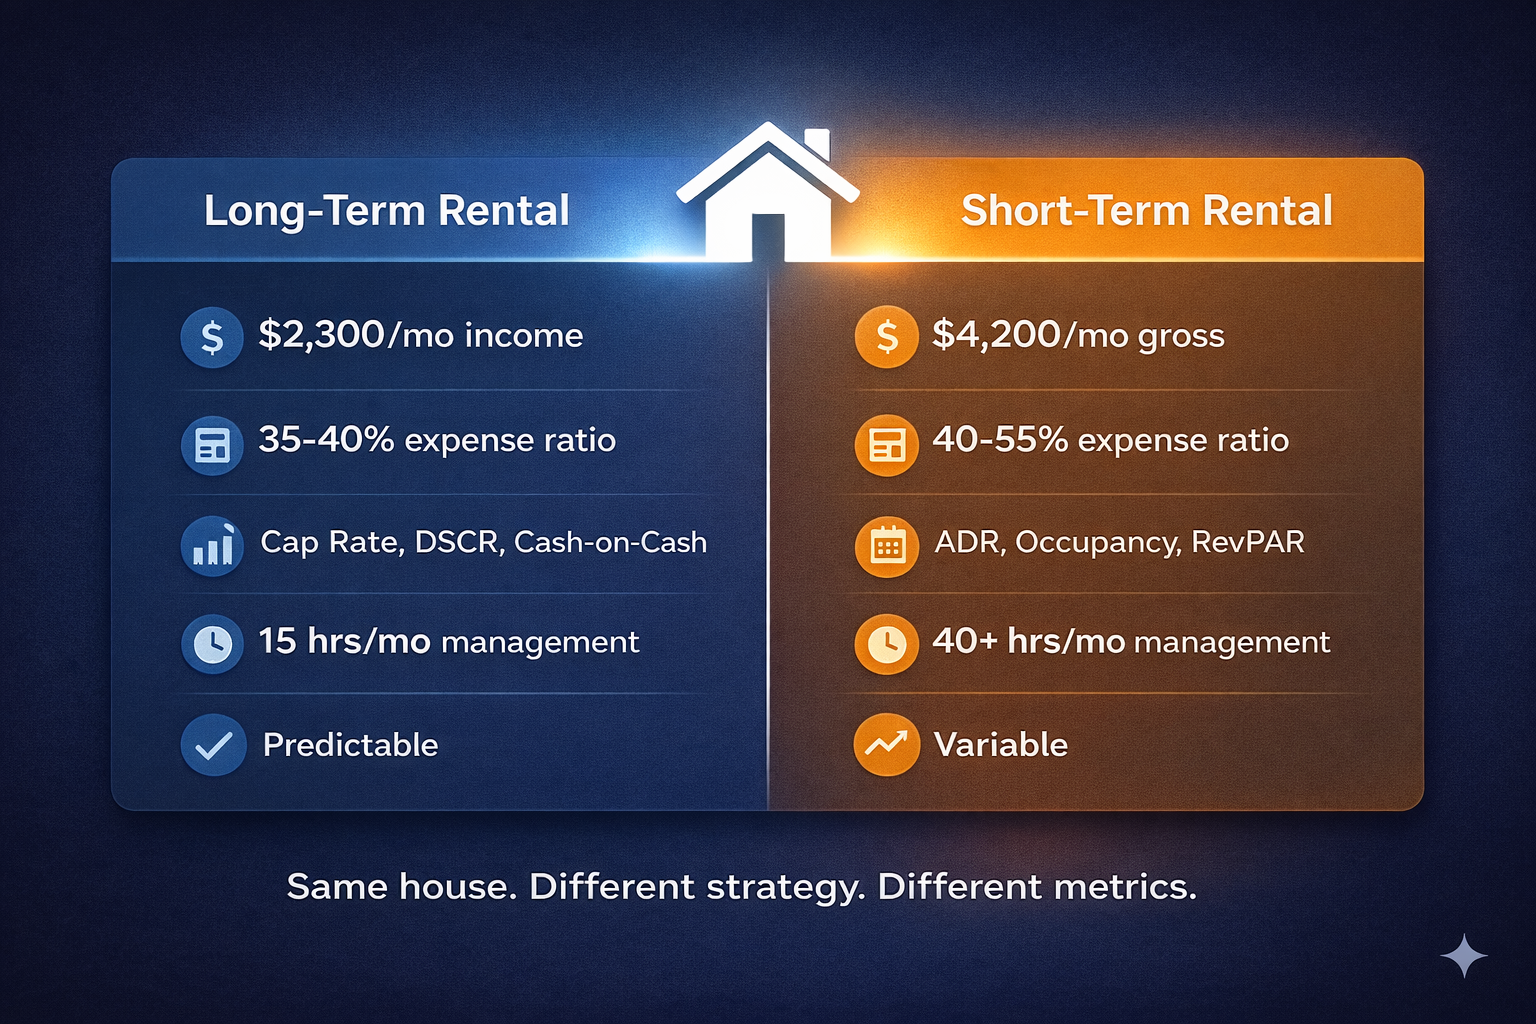
Two neighbors buy identical houses on the same street in the same month. Both pay $315,000. Both put 20% down. One year later, one of them is netting $2,300 a month. The other is netting $4,200 a month.
Same house. Same street. Same purchase price. The difference is not location, condition, or timing. The difference is strategy.
Who This Is For
If you own a single family home - or you're analyzing whether to buy one - this post is for you. It's also for investors who already hold multiple property types and want to understand why the category of an asset matters as much as the asset itself.
This is Part 1 of a 16-week series covering every major real estate asset class. If you want to understand which financing tools apply to each strategy before you read further, start with Which Loan Fits Which Property.
| Part | Asset Class |
|---|---|
| 1 | Single Family Homes (You Are Here) |
| 2 | Duplexes, Triplexes, Fourplexes |
| 3 | Small Apartments (5-25 Units) |
| 4 | Large Apartments (25+ Units) |
| 5 | Commercial RE: Office, Retail, Industrial |
| 6 | Self-Storage Facilities |
| 7 | Mobile Home Parks (Coming Soon) |
The Problem: "Single Family Rental" Is Not One Thing
The real estate industry has a labeling problem. Pull up any spreadsheet template, any portfolio tracker, any app that isn't purpose-built for this - and you'll find one bucket called "single family rental." Sometimes it's just "residential."
That label papers over eight fundamentally different strategies, each with:
- A different income profile
- A different expense structure
- Different tax treatment
- A different management burden
- Different risk characteristics
- Different metrics you should be tracking
A house leased to a travel nurse for four months furnished is not the same financial instrument as a house leased to a family on a 12-month lease. Running them through the same analysis gives you numbers that are technically correct and practically useless.
Worse, if you own both types and average the performance, you're comparing apples to oranges inside your own portfolio - and drawing conclusions from the result.
Here are the eight ways the same single family home can be deployed, what each one actually looks like financially, and why the distinction matters.
Strategy 1: Long-Term Rental (LTR)
What it is: A standard 12-month (or longer) lease to a single household. The bread and butter of residential real estate investing.
Real example: A 3BR ranch in Acworth, GA, leased at $2,300/month on a 12-month lease. Taxes and insurance run $350/month. Property management is $207/month (9%). Maintenance averages $150/month. Net operating income: roughly $19,116/year. On a $315,000 purchase with $63,000 down, that's a cash-on-cash return of around 8-9% after debt service - assuming a 30-year conventional loan at market rates.
Metrics that matter:
- Cap rate (NOI / property value)
- Cash-on-cash return (annual cash flow / cash invested)
- DSCR - Debt Service Coverage Ratio (NOI / annual debt payments). A DSCR above 1.25 means the property can comfortably service its own debt. See how to calculate yours.
Management intensity: Low to moderate. One tenant, one lease, one annual renewal conversation.
Best for: Investors who want predictable income, minimal active management, and long-term equity accumulation.
Strategy 2: Short-Term Rental (STR)
What it is: Nightly or weekly rental via platforms like Airbnb or VRBO. The same house that nets $2,300/month as an LTR might gross $5,000-$6,000/month as an STR - before expenses.
Real example: The identical house in the same neighborhood, listed on Airbnb at $149/night. At 65% occupancy (roughly 20 nights/month), gross revenue hits $2,980/month. At 75% occupancy, that's $3,427/month. Add weekend pricing bumps and a peak season surge and $4,200/month net is achievable in a market with real demand.
Metrics that matter:
- ADR (Average Daily Rate): What you earn per night booked
- Occupancy rate: Percentage of available nights actually booked
- RevPAR (Revenue Per Available Room): ADR x occupancy rate - the single number that tells you if your pricing and demand are working together
The catch: Expense ratios are significantly higher. Platform fees (3%), cleaning between every stay, supplies, higher utilities, and furnishing costs all eat into the gross revenue advantage. STRs typically run 40-55% expense ratios vs. 35-40% for LTRs. Cash flow is seasonal and volatile.
Management intensity: High. You're running a hospitality business, not a rental.
Best for: Investors in high-demand tourism or business markets willing to actively manage or pay for professional co-hosting.
Strategy 3: Mid-Term Rental (MTR)
What it is: Furnished rentals for stays of one to six months. The "travel nurse play" - named for the healthcare workers who need a furnished home near a hospital for a 13-week contract.
Real example: That same 3BR in Acworth, listed furnished at $3,100/month on a 3-month minimum. Between travel nurses, corporate contractors, and remote workers in transition, it stays 85% occupied. Average stay: 11 weeks.
Why it works: You get higher monthly rent than a traditional lease ($3,100 vs. $2,300 in this example), without the nightly chaos of STR. Turnover is lower than STR. Management burden is moderate.
Metrics that matter:
- Furnished monthly rate vs. LTR rate (the premium you capture for furnishing and flexibility)
- Vacancy between tenants (the gap risk - what's your average days vacant between bookings?)
- Effective annual occupancy
The catch: This market is supply-sensitive. In a city with five travel nurse MTRs, you're fine. In a city with fifty, pricing pressure compresses the premium quickly.
Best for: Investors near hospitals, universities, military bases, or corporate campuses with rotating contractor populations.
Strategy 4: Student Housing
What it is: Renting by the bed, not the unit, to college students near a campus. A 4BR house near a major university might lease four individual beds at $750/bed - generating $3,000/month gross instead of $2,000/month as a traditional whole-unit rental.
Real example: A 4BR house a half-mile from a state university, leased to four students on individual lease agreements at $800/bed. Gross: $3,200/month. Parents often co-sign.
Metrics that matter:
- Revenue per bed
- Semester occupancy vs. annual occupancy (summer vacancy is real)
- Turnover cost per bed (paint, carpet, cleaning every 9-12 months)
The catch: By-the-bed leasing means more lease paperwork and more tenant management. Summer vacancy is a structural feature of the model - plan for 2-3 months of reduced occupancy annually. Properties take more physical abuse.
Best for: Investors near large universities who are willing to manage the leasing complexity in exchange for above-market per-unit revenue.
Strategy 5: Corporate Housing
What it is: A fully furnished home leased directly to a company for employee housing. The company pays the rent, not an individual. Stays typically run 30-180 days.
Real example: A 3BR in a suburban market near a corporate campus, leased to a company relocating employees at $4,000/month, furnished. The company wants the home ready for rotating employees - one in, one out, without the tenant having to furnish anything.
Why it works: Corporate tenants default at near-zero rates. The lease structure is predictable. You're not dealing with an individual's financial volatility - you're dealing with accounts payable at a company.
Metrics that matter:
- Monthly rate vs. LTR and MTR rates (premium for corporate guaranty)
- Furnishing investment and depreciation schedule
- Lease renewal rate - once a company has a reliable furnished home near their campus, they tend to stay
The catch: You need relationships to find corporate tenants. This isn't a "list on Airbnb and wait" model. Outreach to HR departments, relocation companies, and corporate housing platforms is required.
Best for: Investors near corporate campuses, hospitals, or government facilities with rotating employee populations who are willing to invest in furnishing and business development.
Strategy 6: Primary Residence
What it is: Owner-occupied. You live in it. This is the largest asset most households own, and it belongs in any serious portfolio analysis - even though it generates no income.
Why it matters financially:
- Appreciation play: A home that appreciated from $315,000 to $420,000 over five years generated $105,000 in equity. That is a return.
- Mortgage interest deduction (subject to limits and your tax situation)
- Capital gains exclusion: Up to $250,000 in gains ($500,000 for married filing jointly) are excluded from capital gains tax if the home was your primary residence for at least 2 of the last 5 years. This is one of the most favorable tax treatments available to individual investors.
- Forced savings: Principal paydown builds equity whether you think about it or not.
Metrics that matter:
- Appreciation rate vs. local market benchmarks
- Equity position and LTV (Loan-to-Value)
- Equity available for deployment (HELOC, cash-out refinance)
The mistake most investors make: Excluding their primary residence from portfolio analysis entirely. If your home is worth $571,000 and you owe $520,000, that $51,000 in equity is part of your net worth. It belongs on the same dashboard as your rentals.
Strategy 7: Vacation Home
What it is: A property you use seasonally for personal enjoyment, with optional rental income during periods you're not using it.
The tax complexity here is real: The IRS has specific rules that govern whether a vacation home is treated as a rental property or a personal residence for tax purposes. The dividing line is personal-use days vs. rental days. If you rent the home for fewer than 15 days in a year, the rental income is tax-free. If you rent it for more than 14 days and personal use exceeds the greater of 14 days or 10% of rental days, you're in mixed-use territory with partial deduction rules.
Real example: A lakefront home used personally for 6 weeks in summer. Rented for 8 weeks via VRBO at $2,800/week. Gross rental income: $22,400. Under IRS rules at this personal/rental day split, expense deductions are prorated.
Metrics that matter:
- Personal use days vs. rental days (determines tax treatment)
- Net rental income after prorated expenses
- Total cost of ownership relative to appreciation upside
Best for: Investors who have a location they genuinely want to use personally and want to offset carrying costs with rental income. Not a pure investment vehicle - the personal-use restriction limits optimization.
Strategy 8: Personal Storage
What it is: A property - often a rural home on acreage - used to store equipment, vehicles, RVs, planes, boats, or inventory. No rental income. Pure equity and land appreciation play.
This is the category that surprises people most.
Real example: A rural farmhouse on 5 acres purchased for $180,000. The owner stores three vintage vehicles, a boat, and landscaping equipment on the property. No tenants, no income. But the land is appreciating in a county with development pressure, and the owner has a use for the storage that would otherwise cost $1,200/month in commercial storage fees.
Why it belongs in portfolio analysis:
- The asset has equity
- The land has appreciation trajectory
- The implied value (avoided storage cost) has economic meaning even if it's not rental income
Metrics that matter:
- Land value per acre and county comparables
- Appreciation rate
- Opportunity cost (what you could generate if you deployed the asset differently)
Best for: Investors with specific storage needs who also want real estate exposure on a budget, or rural landholders accumulating acreage in areas with long-term development potential.
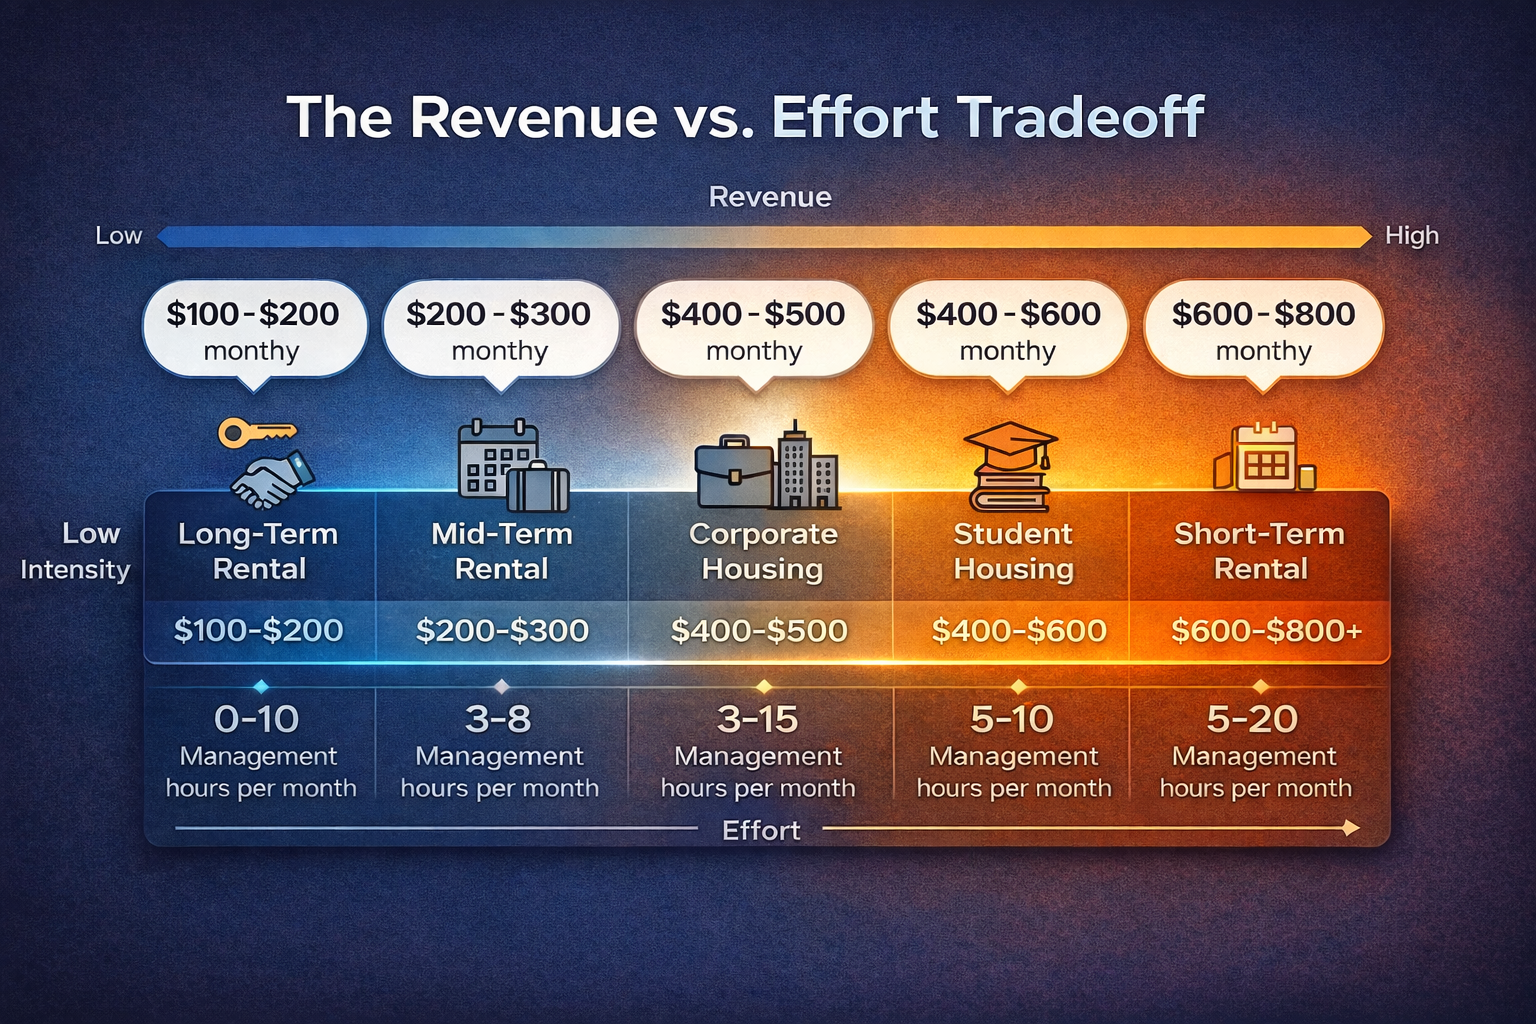
Why the Category Is Not a Label - It's a Calculation Input
Here is where this gets practical for anyone managing more than one property.
The eight strategies above are not cosmetic distinctions. Each one changes:
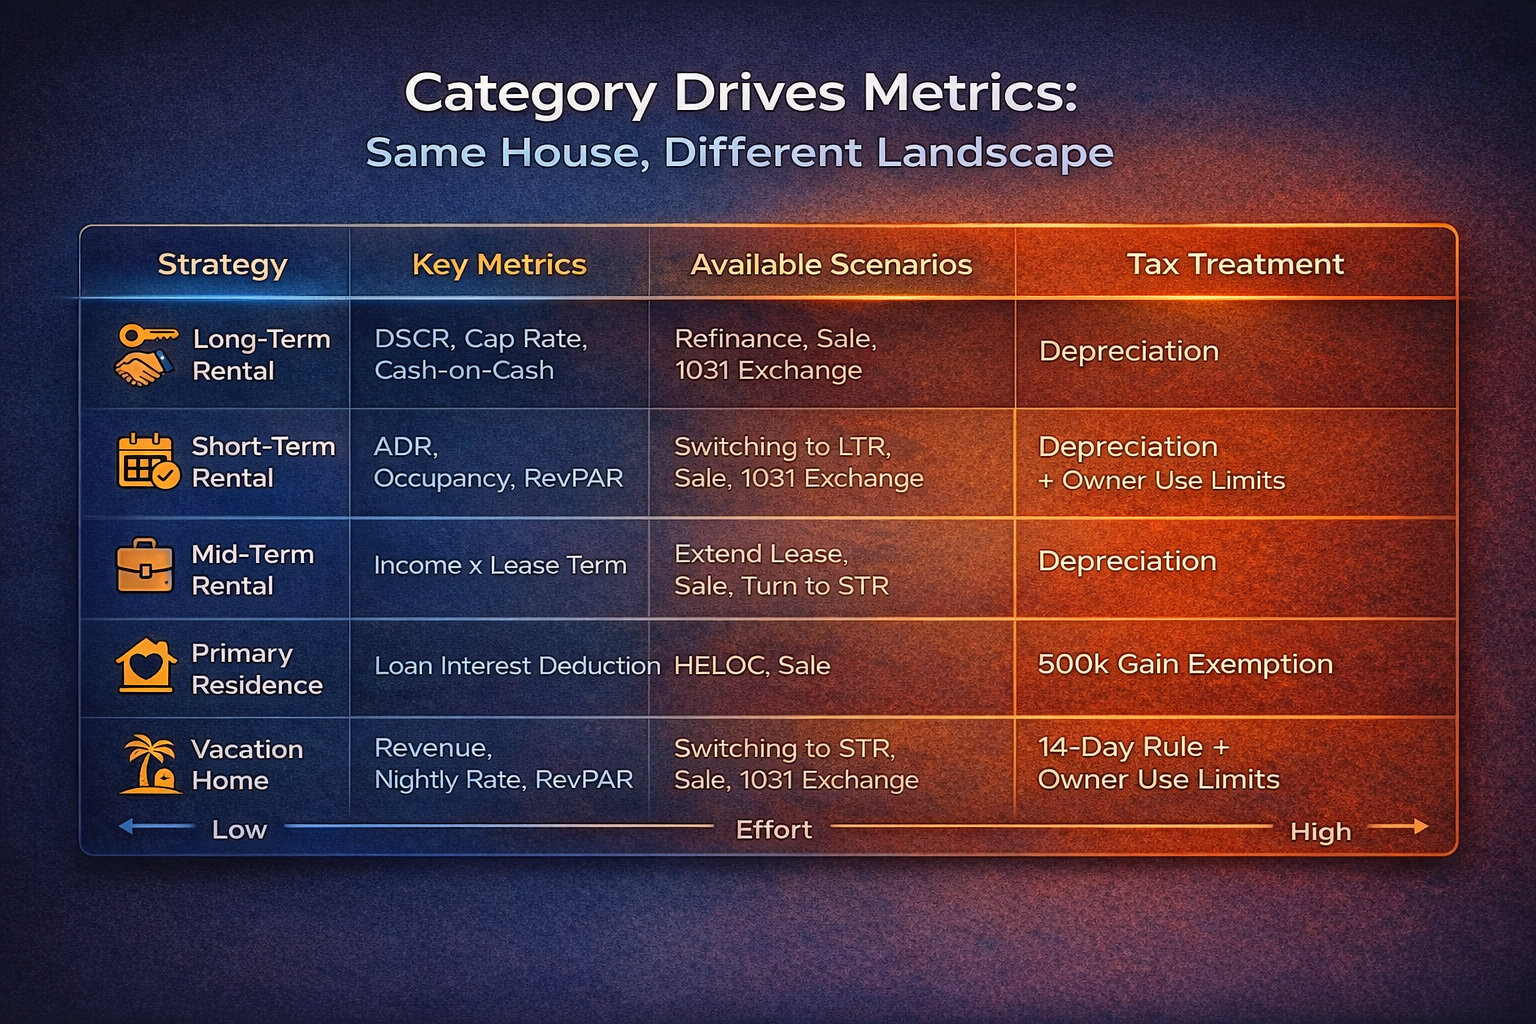
What you track: Cap rate and DSCR matter for LTR. ADR and RevPAR matter for STR. Neither metric is meaningful for a primary residence. Tracking primary residence appreciation requires different data than tracking rental yield.
What you can model: A BRRRR scenario (Buy, Rehab, Rent, Refinance, Repeat) only makes sense on an investment property. Running it on your primary residence produces nonsense output. A sell scenario for a primary residence involves the capital gains exclusion calculation. A sell scenario for an STR does not.
How you compare assets: If you own an LTR and an STR and average their performance, you're comparing two fundamentally different businesses. The LTR runs at a 35% expense ratio. The STR runs at a 50% expense ratio and generates 80% more gross revenue. Averaging those numbers tells you nothing actionable.
How you understand your own portfolio: As we explored in our post on tracking mixed-asset portfolios, the problem isn't the diversity - it's the lack of structure. A portfolio with an LTR, an STR, and a primary residence is not three "houses." It's three different financial instruments that happen to look the same from the street.
For the right financing on each strategy, see our guide on which loan fits which property type - DSCR loans favor LTR income, conventional loans favor primary residences, and short-term rental income is treated differently by every lender.
How Nimbus Portfolio Handles This
Nimbus Portfolio separates "asset type" (what the property physically is - single family home) from "asset category" (how you're using it today - long-term rental, STR, primary residence, etc.).
This is not cosmetic. The category you assign drives which metrics the platform calculates, which scenarios are available to you, and how the asset appears in your portfolio analysis. BRRRR and hold-vs-exit scenarios are only available for investment categories. Primary residences get the capital gains exclusion model instead. If you convert a primary residence to a long-term rental, you change the category - and the platform recalibrates your metrics, your scenario options, and your portfolio composition automatically.
If you own multiple single family homes using different strategies - which a surprising number of serious investors do - you can model the numbers on a new acquisition here, check if a property can pay for itself, and see your actual cash-on-cash return for each asset, broken out by how you're actually using it, not lumped into one undifferentiated bucket.
What Comes Next in This Series
This is Part 1 of a 16-week series. Next up: multi-family properties - duplexes through small apartment buildings - where the unit count changes not just the income but the entire financing, management, and valuation framework.
Start Tracking Your Properties the Way They Actually Function
A single family home is not a monolithic asset class. It's a structure that can be deployed eight different ways, each with a different financial logic. The strategy you choose - or the one you've defaulted into without choosing - determines your income, your tax situation, your management burden, and your portfolio performance.
Track them accordingly.
Create a free account and add your first property in under two minutes. Get started at Nimbus Portfolio
Nimbus Portfolio tracks 19+ real estate asset types and categories. Free tier available. Portfolio plan at $24/month or $190/year. Portfolio+ at $49/month or $390/year.
Frequently asked questions
What is the best strategy for a single family home investment?
There is no single best strategy. Long-term rentals offer the lowest management burden. Short-term rentals generate the highest gross income but require the most operational work. Mid-term and corporate housing sit in between. The right strategy depends on local regulations, financing, and how actively you want to manage the property.
Can I use an FHA loan to buy a single family home and rent it out?
FHA loans require owner occupancy for at least 12 months. You can live in the home for a year, then convert it to a long-term rental. You cannot purchase a single family home with an FHA loan intending to rent it from day one.
How much more does a short-term rental earn than a long-term rental?
Short-term rentals typically gross two to three times more than a long-term rental in the same market, but net income depends on occupancy, cleaning fees, platform fees, furnishing costs, and local regulations. Many markets now restrict or tax short-term rentals, which compresses the gap.
What tax treatment changes if I convert my primary residence to a rental?
When you convert your home to a rental, you begin depreciating the structure over 27.5 years, deducting operating expenses against rental income, and over time losing access to the primary residence capital gains exclusion. Keep records of your cost basis before converting.