Commercial Real Estate Investing: Office, Retail, and Industrial Properties
A retail strip center and a 48-unit apartment building can produce the same NOI. But if the strip center's anchor tenant closes tomorrow, the building's value can drop 30% overnight without a single expense changing. The apartment building loses one unit. The strip center loses its reason to exist.
That is the essential difference between commercial real estate and everything covered in the first four parts of this series. The income is not about who lives there. It is about who signed the lease.
Who This Is For
If you own, are analyzing, or are seriously considering commercial property in the office, retail, or industrial category, this post breaks down five strategies investors use to acquire and operate these assets, what each looks like in practice, and why the risk and return framework is fundamentally different from residential investing.
This is Part 5 of a 16-week series covering every major real estate asset class. Part 1 covered single family homes. Part 2 covered duplexes, triplexes, and fourplexes. Part 3 covered small apartment buildings in the 5-25 unit range. Part 4 covered large apartment complexes at 25+ units. If you want a financing foundation before going further, see which loan fits which property type.
| Part | Asset Class |
|---|---|
| 1 | Single Family Homes |
| 2 | Duplexes, Triplexes, Fourplexes |
| 3 | Small Apartments (5-25 Units) |
| 4 | Large Apartments (25+ Units) |
| 5 | Commercial RE: Office, Retail, Industrial (You Are Here) |
| 6 | Self-Storage Facilities |
| 7 | Mobile Home Parks (Coming Soon) |
The Problem: Everything You Learned in Parts 1-4 Still Applies. The Risk Profile Is Completely Different
Four parts in, the NOI-based valuation formula is familiar. Annual net operating income divided by the cap rate equals value. Increase NOI, increase value. That math is the same whether you own 30 apartments or a 20,000 square foot retail plaza.
But in commercial real estate, NOI is not driven by 30 separate tenants paying rent. It is driven by one tenant, or three, or seven. Each one is a business with its own financial health, its own lease terms negotiated years ago, and its own reason for being in your building. When a residential tenant moves out, you have 30 days of vacancy, a clean unit, and a new tenant within 45 days. When a commercial tenant exits, you may have an empty space measured in thousands of square feet, no income for 6-18 months, and a tenant improvement budget required to attract the next occupant.
The fundamental shift in commercial real estate is this: tenant creditworthiness is the primary risk metric. Not location alone. Not building condition alone. Who is on the lease, how long they are committed, and how financially stable they are. A dollar-store franchise on a 10-year lease with a corporate guarantee is worth more to most investors than an independent restaurant on a 3-year lease regardless of which business you would personally rather patronize.
The lease structure shifts too. Residential leases run 12 months. Commercial leases run 5, 10, or 15 years. That longevity is a feature, not a coincidence. It is what allows a commercial investor to finance a building, stabilize income, and hold without constant re-leasing cycles. But long leases also mean that below-market rents get locked in for years. Lease structure decisions made at signing compound for a decade.
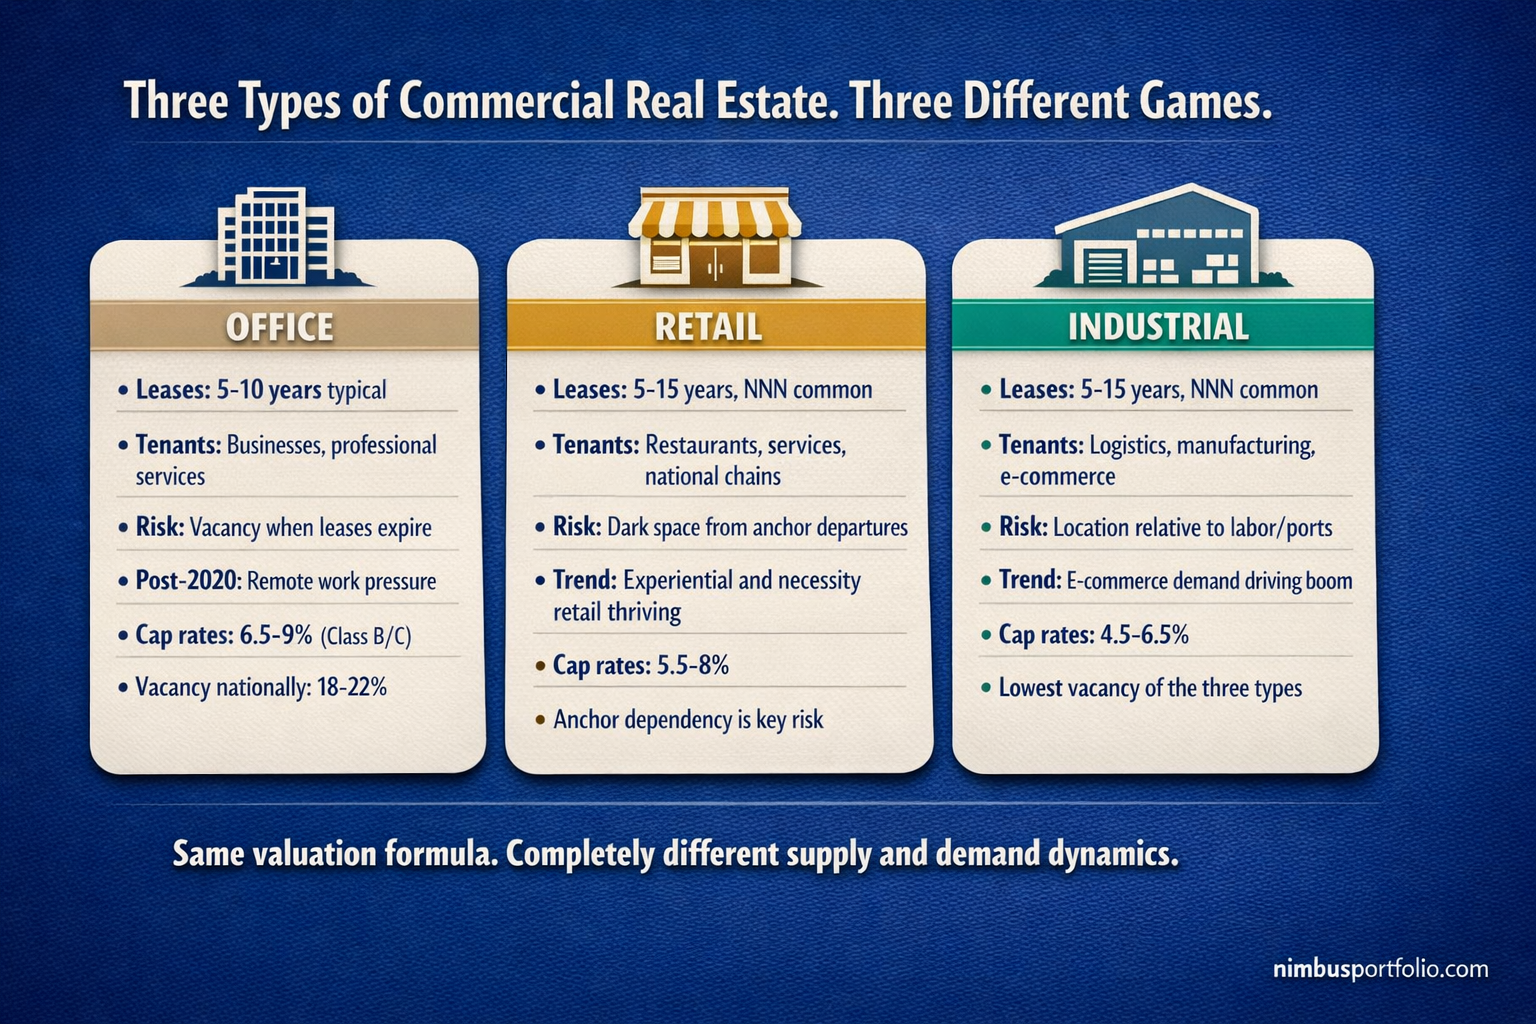
The three sub-types are genuinely different games. Office, retail, and industrial share the same valuation framework and often the same lenders. They operate in completely different supply and demand environments. A well-located industrial property near a port has been one of the best-performing commercial asset classes of the past decade. A Class B office building in a secondary market has been one of the most challenging. They are not interchangeable, and treating them as a single category is how investors get into trouble.
Strategy 1: Single-Tenant NNN Net Lease
What it is: Buying a freestanding commercial building leased to a single corporate tenant on a triple-net (NNN) lease. Triple-net means the tenant pays the property taxes, building insurance, and most maintenance costs directly. The landlord collects a base rent check every month and is largely passive for the duration of the lease term. The building's value is a direct function of the tenant's credit quality and the remaining lease term.
Real example: A freestanding 2,400 square foot Dollar General in a small town in Georgia. Purchase price: $1,350,000. Annual rent: $81,000. Operating expenses paid by tenant under the NNN lease structure. Landlord's annual expenses: minimal (roof and structure only, roughly $2,000-$3,000 in reserve). Effective NOI to the investor: approximately $79,000. Cap rate at acquisition: 5.85%.
Financed with a commercial loan at 7.0% fixed for 10 years, 25-year amortization, 30% down ($405,000). Annual debt service: approximately $63,500. Annual cash flow after debt service: roughly $15,500. Cash-on-cash return: 3.8%.
That cash-on-cash return looks thin compared to anything in Parts 1-4. But the tenant is Dollar General Corporation, a publicly traded company with investment-grade credit. The lease has 11 years remaining with two 5-year renewal options at fixed rent escalations of 10% per option period. The investor makes no management decisions. Zero maintenance calls. The rent arrives on the first of the month. This is not an income maximization strategy. It is a passive income stability strategy, typically used by investors who want capital preservation, tax advantages through depreciation, and predictable cash flow without operational responsibility.
The lease structure matters enormously: A 15-year lease with 5 years remaining is worth far less than a 15-year lease with 12 years remaining, all else equal. As the remaining term shrinks, the buyer pool for that building narrows and the cap rate demanded by buyers rises, which compresses value. Investors who pay attention to weighted average lease term (WALT) avoid selling into that compression.
The dark space risk: A single-tenant NNN building is worth close to land value if the tenant exits and the building does not lease quickly. Dollar General does not close locations casually. A local pizza franchise on a single-tenant NNN does. Tenant credit quality is not just a preference. It is the primary underwriting question.
Metrics that matter:
- Tenant credit rating or financial strength. Investment-grade corporate tenants (Walgreens, Dollar General, McDonald's) are priced differently from regional or local tenants.
- Remaining lease term and renewal option structure. Model the full hold period including what happens at lease expiration.
- Rent escalations built into the lease. Flat rent for 15 years at a 5.5% cap rate has very different economics than 10% bumps every 5 years.
- Cap rate relative to 10-year Treasury rates. NNN investments are often compared to bonds. The spread between NNN cap rates and Treasury yields signals relative value.
- DSCR at acquisition. Commercial lenders require 1.25-1.35x minimum.
Management intensity: Very low. This is the most passive commercial real estate strategy available to individual investors. The tenant handles day-to-day building operations. The investor manages the lender relationship, monitors lease status, and plans for lease expiration 2-3 years in advance.
Best for: Investors seeking passive income, capital preservation, and simplicity. Common exit for active investors who want to move out of intensive management. Also popular with 1031 exchange buyers who need to place capital quickly in a stable, hands-off structure.
Strategy 2: Retail Strip Center
What it is: A multi-tenant retail building with 5-15 tenants occupying individual suites, typically in the 1,200-4,000 square foot range per unit. Strip centers are neighborhood-serving retail: nail salons, dry cleaners, dentists, insurance agencies, pizza places, cell phone repair shops. The investment thesis is income diversification across multiple tenants, with no single tenant representing enough of the rent roll to collapse the building if they leave.
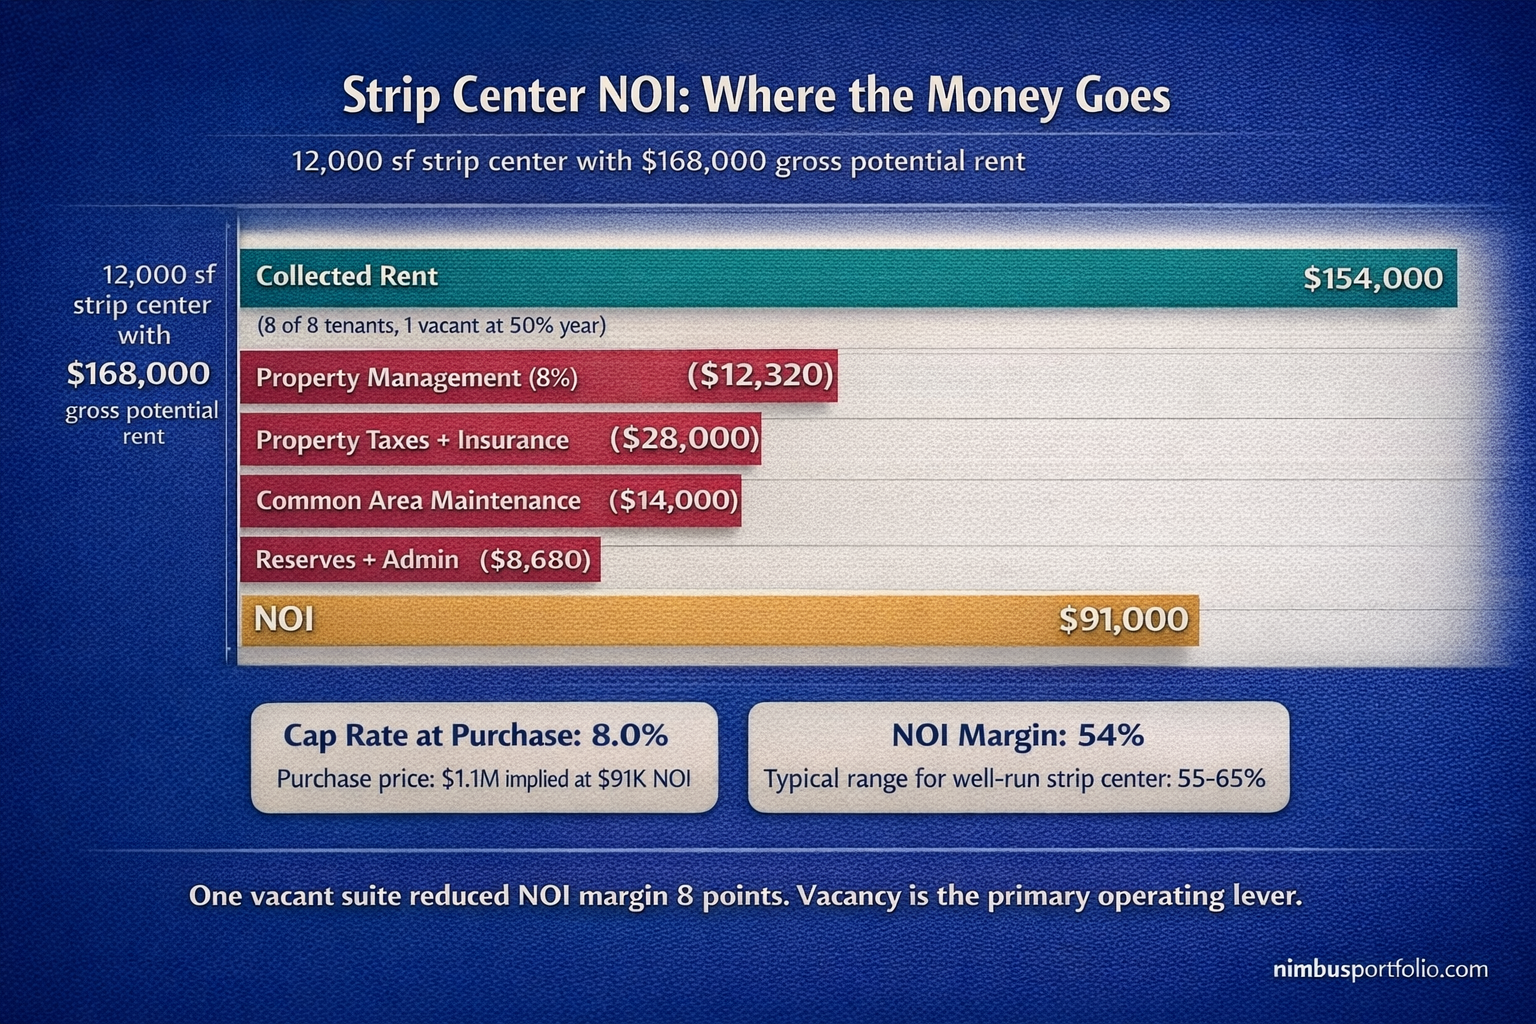
Real example: A 12,000 square foot strip center in a suburban market outside of Charlotte. Eight tenants, average suite size 1,500 square feet. Total gross rent: $168,000/year ($14/sf). Vacancy: one suite at $1,500/month while it re-leases. Operating expenses including property management at 8%, taxes, insurance, common area maintenance (the landlord's share): $63,000. NOI: $105,000. Purchase price: $1,312,500 at an 8.0% cap rate.
Financed with a commercial loan at 7.25% fixed for 10 years, 25-year amortization, 30% down ($393,750). Annual debt service: approximately $77,000. Annual cash flow: approximately $28,000. Cash-on-cash return: 7.1%.
The key operational variable in a strip center is the lease rollover schedule. If three of eight leases expire in the same year, the landlord faces simultaneous re-leasing risk across 36% of the building. Good strip center management staggers lease expirations so no single year carries more than 20% of gross rents at risk of renewal or departure.
Tenant improvement allowance: When a new commercial tenant signs a lease, they often require a tenant improvement (TI) allowance from the landlord to customize the space. A restaurant moving into a vanilla shell suite might need $60,000-$120,000 in buildout to make the space functional. The landlord often contributes $25-$50/sf as a TI allowance, amortizing that cost into a slightly higher rent over the lease term. First-time strip center buyers who do not model TI budgets for vacant suites routinely underestimate the true cost of lease-up.
The post-2020 retail landscape: National chain retail has been under pressure since e-commerce accelerated in 2020. But necessity and experiential retail has held and grown. Grocery-anchored strip centers, medical and dental offices, restaurants (especially fast-casual and quick-service), fitness studios, and personal services have maintained strong occupancy because they require a physical presence to deliver the service. Strip centers anchored by a grocery store have demonstrated the best occupancy stability of any retail format. Strip centers anchored by national soft goods retailers have faced sustained pressure. The tenant mix tells most of the story.
Metrics that matter:
- Occupancy rate and weighted average lease expiration. These two numbers summarize near-term income risk.
- Rent per square foot vs. market rent. Below-market leases create near-term value when they roll. Above-market leases create renewal risk.
- TI budget for vacant and expiring suites. Every vacant suite that re-leases likely requires landlord capital.
- Anchor tenant's lease term and renewal probability. If one tenant is 30% of the rent roll, they are not diversification. They are concentrated risk.
- NOI margin: NOI divided by gross potential rent. Strip centers typically run 55-65% NOI margins when well-occupied.
Management intensity: Moderate. A property management firm handles tenant relations, maintenance, and lease administration at 6-9% of gross rents. The investor's role is capital decisions, lease renewal negotiations, and strategic tenant mix management. Re-leasing a vacant suite requires active involvement from the owner.
Best for: Investors who want higher yield than single-tenant NNN, are comfortable with moderate operational involvement, and have the capital reserves to handle TI and vacancy between tenants. Strip centers with strong anchor tenants and diverse service-oriented tenant mixes have proven more resilient than malls or power centers.
Strategy 3: Value-Add Office Repositioning
What it is: Acquiring an underperforming office building at a depressed price, investing capital to modernize the space and tenant mix, and either stabilizing for long-term hold or selling at a compressed cap rate on higher NOI. This is the commercial equivalent of the residential value-add playbook, but executed in an asset class facing structural headwinds from remote work that require careful market selection.
Real example: A 24,000 square foot Class B suburban office building in a growing secondary market with a strong employer base. Current occupancy: 72%, with two tenants totaling 6,720 square feet on leases expiring within 14 months. Purchase price: $2,016,000, reflecting the current NOI of $151,200 at a 7.5% cap rate on occupied space.
The repositioning plan: Convert 4,000 square feet of inefficient open-plan space into 8-10 private office suites targeting small professional services firms (accountants, attorneys, insurance agents) who need 400-600 square foot private offices rather than full-floor leases. Renovation budget: $380,000 ($95/sf for modern finishes, new HVAC zoning, and upgraded common areas with a hospitality-style lobby).
Projected stabilized rent on converted suites: $28/sf, compared to the existing $22/sf bulk office rate. Stabilized gross rent at 95% occupancy: $638,400. Operating expenses at 42%: $268,128. Stabilized NOI: $370,272. At a 7.0% exit cap rate (tighter than acquisition because occupancy and tenant quality improved): value of $5,289,600.
That is a $3.27 million increase in value on a $2.4 million total investment (purchase plus renovation). The math works. But office repositioning requires genuine conviction in the submarket. A suburban office building in a market where employers are downsizing lease footprints will not stabilize regardless of the renovation quality. The strategy works where employment is growing and the gap between Class A and Class B rents justifies the mid-market play.
What does not work in office right now: Class B and C office buildings in oversupplied CBDs (central business districts) of gateway cities are facing structural vacancy driven by remote and hybrid work adoption. These buildings often have vacancy rates above 20% with no clear path to stabilization. The repositioning play requires either a market where office demand is recovering, a conversion to alternative uses (medical office, life sciences, residential), or a pricing level so distressed that the land value alone justifies the acquisition. Many experienced commercial investors are avoiding traditional office entirely and focusing on industrial and necessity retail instead.
Metrics that matter:
- Submarket vacancy rate. Buying an office building in a market with 25% vacancy requires a thesis for why your building outperforms the market average.
- Lease expiration schedule. Knowing which leases expire when, and modeling re-leasing probability, is the core underwriting exercise.
- Rent per square foot vs. market rent. The gap between in-place rent and market rent determines the revenue upside.
- Renovation cost per square foot relative to the rent increase it enables. Office improvements are expensive. The return on that capital depends on achievable rents.
- Conversion optionality. What else could this building become? Medical office, co-working, or residential conversion potential creates a floor under downside scenarios.
Management intensity: High during repositioning. Lease-up requires an active broker relationship and often tenant improvement negotiations for each new lease. After stabilization, a property management firm handles day-to-day operations. Office tenants tend to be lower maintenance than retail tenants once leases are signed, but the re-leasing process requires significant owner involvement.
Best for: Investors with commercial leasing experience, strong local broker relationships, and conviction in a specific submarket's demand fundamentals. Not appropriate as a first commercial deal. The post-COVID office market has separated experienced underwriters from optimistic generalists quickly.
Strategy 4: Industrial and Logistics Acquisition
What it is: Buying warehouse, distribution, light manufacturing, or flex-industrial space leased to businesses that need physical space to store inventory, manufacture product, or operate logistics operations. Industrial has been the strongest-performing commercial real estate category since 2018, driven by e-commerce growth requiring last-mile distribution infrastructure that cannot be replicated digitally.
Real example: A 30,000 square foot distribution warehouse in a well-located industrial park 15 miles from a major metro area. Single tenant: a regional building supply distributor on a 7-year NNN lease. Annual rent: $315,000 ($10.50/sf, triple-net). Tenant pays all taxes, insurance, and maintenance including roof and HVAC. Landlord's annual expenses: property management and minimal structural reserves, approximately $12,000. NOI: $303,000. Purchase price: $4,328,571 at a 7.0% cap rate.
Financed with a commercial loan at 6.75% fixed for 10 years, 25-year amortization, 30% down ($1,298,571). Annual debt service: approximately $228,000. Annual cash flow: $75,000. Cash-on-cash return: 5.78%.
Again, the cash-on-cash return does not tell the full story. Industrial properties in supply-constrained markets have seen 4-8% annual rent growth over the past five years. A lease with 3% annual escalations locked in now looks underpriced in a market where new comparable space is leasing at $14-$16/sf. When this 7-year lease expires, the landlord re-leases at market rate. On a 30,000 sf building, moving from $10.50/sf to $14/sf adds $105,000 in annual NOI, which at a 6% exit cap rate creates $1.75 million in additional value.
The industrial investment thesis is simpler than office or retail: businesses need physical space to move physical goods, and that need does not go away when interest rates rise or consumer preferences shift. The risk is location. Industrial properties near ports, rail yards, major highways, and population centers with labor availability are structurally advantaged. Industrial properties in markets with excess supply, poor highway access, or declining manufacturing bases are not.
Flex industrial: A sub-category worth knowing is flex industrial space: buildings with a mix of warehouse/industrial space (60-70%) and finished office space (30-40%), typically leased to small businesses that need both. Flex industrial leases at lower per-square-foot rates than pure warehouse, but attracts a broader tenant pool and often has shorter lease terms that allow for faster rent mark-to-market. Cap rates on flex industrial typically run 0.5-1.5% above pure warehouse in the same market.
Metrics that matter:
- Location quality: proximity to major highways, population centers, and the tenant's customer base or supply chain.
- Clear height: the vertical clearance inside the warehouse. Modern logistics tenants need 28-36 foot clear heights. Older buildings with 18-22 foot clear heights face a permanent functional disadvantage.
- Dock doors and drive-in bays per square foot: the loading infrastructure determines which tenants can use the building.
- Remaining lease term and rent escalation schedule. Industrial leases with 10% bumps every 5 years versus 2% annual bumps produce materially different outcomes over a 7-year hold.
- Market vacancy rate and new supply pipeline. Industrial markets with under 4% vacancy and limited new supply under construction have pricing power for rent growth.
Management intensity: Very low under NNN structure. The tenant operates the building. Landlord responsibilities are limited to monitoring the lease, maintaining lender compliance, and planning for lease expiration. Flex industrial with shorter leases requires more active re-leasing management.
Best for: Investors who want strong fundamentals, passive income, and an asset class with institutional demand at sale. Industrial attracts the broadest buyer pool at exit: REITs, institutional investors, and individual investors all compete for well-located industrial properties, which creates liquidity that office and some retail lack.
Strategy 5: Sale-Leaseback Acquisition
What it is: A business that owns its own real estate sells the building to an investor and simultaneously signs a long-term lease to remain as the tenant. The business receives a lump sum of capital (which it can redeploy into its core operations) while the investor receives a new tenant with a long lease, typically structured as NNN. Sale-leasebacks are common across all three commercial sub-types: manufacturers selling their plants, retailers selling their store locations, medical practices selling their office buildings.
Real example: A regional auto parts distributor owns a 40,000 square foot warehouse valued at $3,200,000. The business needs capital to expand its fleet and open two new distribution hubs. It sells the warehouse to an investor for $3,200,000 and simultaneously signs a 12-year NNN lease at $224,000/year ($5.60/sf). The investor acquires the building at a 7.0% cap rate with a 12-year lease in place to a tenant who has operated at this location for nine years and has significant operational incentive to remain.
Financed with a commercial loan at 6.75% fixed for 10 years, 30% down ($960,000). Annual debt service: approximately $169,000. Annual cash flow: $55,000. Cash-on-cash return: 5.7%.
The sale-leaseback's structural advantage for the investor is that the lease is negotiated before acquisition, with a tenant who is already proven at the location. There is no leasing risk. There is no vacancy at day one. The tenant has a business incentive to stay because their operations are built around that facility. The risk is what happens at lease expiration: can this tenant renew at market rent, and is this location independently marketable if they do not?
What makes sale-leasebacks attractive to businesses: A company that owns its building has capital tied up in real estate that could be deployed at a higher return in its core business. A manufacturer whose building is worth $3 million and earns 7% as a real estate investment gets only $210,000/year of implied benefit from ownership. If that same $3 million could fund a new production line earning 25% returns, the sale-leaseback creates $750,000 in annual business income while the building's rent costs $224,000/year. The math favors selling and leasing back.
Metrics that matter:
- Tenant business health: this is the same analysis as any other single-tenant NNN, but without the comfort of a national brand's financial backing. Review the tenant's financials before underwriting.
- Lease structure: 12-year leases with rent escalations are materially better than 7-year flat leases. Negotiate the lease before the purchase price is set.
- Alternative tenant marketability: if the tenant exits at the end of the lease, how long does the building sit vacant and what modifications does the next tenant require?
- Replacement cost relative to purchase price. A warehouse that costs $80/sf to build selling at $50/sf provides a buffer against functional obsolescence.
- Escalation schedule. A 3% annual escalation on a $224,000 base grows the rent to $319,000 by year 12, which is $95,000 in additional annual NOI created entirely by the lease structure.
Management intensity: Very low during the lease term. The tenant operates the building. The investor's only active role is monitoring tenant financial health, managing the lender relationship, and planning for lease expiration.
Best for: Investors with commercial underwriting experience who want institutional-style passive income at a scale accessible to individual buyers. Also attractive for 1031 exchange buyers who need a large, stabilized commercial property with minimal post-acquisition workload.
Why the Numbers Work Differently in Commercial
Parts 1-4 covered residential and multifamily investing where valuation is anchored to comparable sales, income drives value at scale, and the risk is distributed across many tenants. Commercial real estate concentrates that risk and that reward differently.
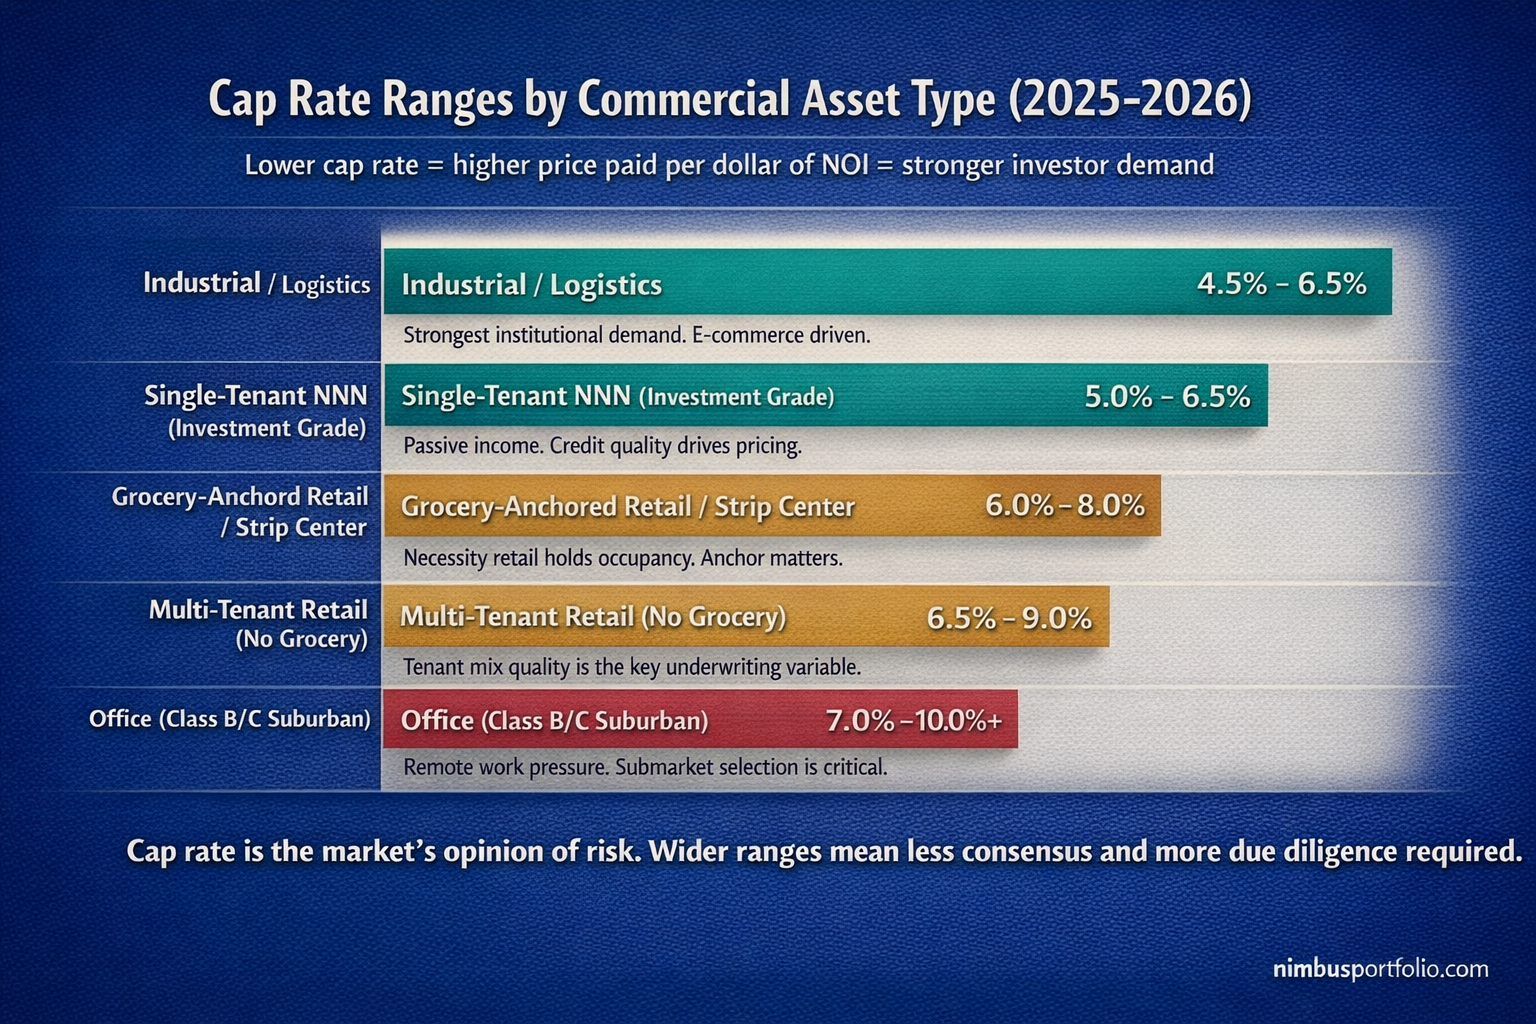
The cap rate is the market's opinion of risk. In residential, you might pay $450,000 for a house because three similar houses sold for $430,000-$470,000 last year. In commercial, you pay $3,200,000 for a building because you and the seller agree that $224,000 in annual NOI is worth a 7.0% cap rate. The comparable sales inform the cap rate expectation, but it is an income multiple negotiation, not a square footage and condition conversation.
Lease structure creates or destroys value without touching the building. A retail building leased at $12/sf on a 3-year lease is worth less than the same building leased at $12/sf on a 10-year lease, even though the rent and the building are identical. The longer lease is worth more because the buyer is acquiring a longer guaranteed income stream. Conversely, above-market leases with 18 months remaining represent concentrated near-term risk. The lease file is as important as the physical inspection.
Financing differs from residential and multifamily. Commercial loans run 5-10 year fixed terms with balloon payments, versus 30-year residential mortgages. At the end of the fixed period, the loan either refinances or the balloon must be paid. Underwriting a commercial property without modeling the balloon and what refinancing looks like in a higher-rate environment is incomplete analysis. The debt service on a 10-year balloon note that refinances into a materially higher rate environment can turn a profitable property cash-flow negative overnight.
For context on how leverage interacts with commercial NOI dynamics and what it means for your total portfolio return, the leverage explainer covers the mechanics from portfolio level. And for understanding how total return on equity captures appreciation, debt paydown, and cash flow together, that framework applies directly to commercial holds.
How Nimbus Handles This
A single-tenant retail building with a 9-year NNN lease does not fit neatly into a residential property tracking tool. The income structure is different. The expense structure is different. The metrics that matter, NOI margin, DSCR, weighted average lease term, expense ratio, are different from what a duplex owner tracks.
Nimbus Portfolio tracks commercial properties at the asset level with the metrics that matter: NOI, cap rate, cash-on-cash return, DSCR, expense ratio, equity position, and valuation history with monthly snapshots. You can log the lease terms, rent escalation schedule, and tenant details for each commercial property. When you pull up that asset, you see its financial picture: not a residential summary that was not designed for commercial income structures.
The portfolio view is where mixed-asset investors get clarity. If you own a single family rental in Atlanta, a duplex in Denver, and a retail strip center in suburban Charlotte, Nimbus rolls all three into a single dashboard: total portfolio value, total equity, total cash flow, and asset allocation by type. The three properties use different financing structures and different valuation frameworks. They sit side by side in the same view, at the same time. See how a mixed portfolio looks from a single view.
Scenario modeling works at the commercial property level too. You can model a refinance when a 10-year balloon matures, run a stress test on what happens when occupancy drops 20%, or analyze hold vs. exit when a long-term tenant signals they may not renew. The buy scenario tool, DSCR calculator, and cash-on-cash calculator are all free and require no account.
What Comes Next in This Series
This is Part 5 of a 16-week series. Next up: self-storage facilities. Storage is commercial real estate that behaves unlike any of the three asset types covered here. Month-to-month leases instead of 5-year commitments, no tenant improvement allowances, no lease negotiation, and revenue management software that adjusts rates dynamically the way airlines do. The economics are simple at first glance and genuinely nuanced once you understand occupancy dynamics and the difference between a lease-up facility and a stabilized one.
Start Tracking Your Commercial Property the Way Its Performance Demands
A 12,000 square foot strip center is not a rental property. It is a commercial asset whose value is a direct function of tenant quality, lease structure, and NOI stability. Tracking it alongside your residential properties, or not tracking it at all, means losing visibility into the signals that tell you whether to hold, refinance, or exit.
Add your first property in under two minutes and see your numbers the way they actually work. Get started at Nimbus Portfolio
Nimbus Portfolio tracks 19+ real estate asset types and categories. Free tier available. Portfolio plan at $24/month or $190/year. Portfolio+ at $49/month or $390/year.