Self-Storage Investing: Strategies, Economics, and Why the Math Works Differently
A commercial retail tenant who wants to leave hands you 90 days notice, a TI allowance bill, and a vacancy that could sit for 12 months. A self-storage tenant who wants to leave sends a text message, clears their unit, and stops paying. The next tenant starts paying on the first of next month.
That is not a problem. That is the feature.
Who This Is For
If you own a self-storage facility, are evaluating one for acquisition, or are just trying to understand why storage has attracted so much institutional capital over the past decade, this post breaks down five strategies investors use to enter and operate these assets, what each looks like with real numbers, and why the economic structure is genuinely different from everything covered so far in this series.
This is Part 6 of a 16-week series covering every major real estate asset class. Part 1 covered single family homes. Part 2 covered duplexes, triplexes, and fourplexes. Part 3 covered small apartment buildings in the 5-25 unit range. Part 4 covered large apartment complexes at 25+ units. Part 5 covered commercial real estate including office, retail, and industrial.
| Part | Asset Class |
|---|---|
| 1 | Single Family Homes |
| 2 | Duplexes, Triplexes, Fourplexes |
| 3 | Small Apartments (5-25 Units) |
| 4 | Large Apartments (25+ Units) |
| 5 | Commercial RE: Office, Retail, Industrial |
| 6 | Self-Storage Facilities (You Are Here) |
| 7 | Mobile Home Parks (Next Week) |
The Problem: Everything You Learned in Part 5 Still Applies. Almost None of the Risk Mechanics Do
By the time you reach self-storage, the NOI-based valuation framework is familiar. Net operating income divided by cap rate equals value. Increase NOI, increase value. That math has not changed.
What has changed is every assumption underneath the income line.
In Part 5, the primary risk in commercial real estate was tenant creditworthiness and lease structure. A single tenant on a long-term lease represented concentrated income risk. Re-leasing a commercial space required tenant improvement budgets of $30-$80 per square foot. Lease negotiations ran for months. Vacancy in a commercial building meant months of zero income from a significant portion of the rent roll.
Self-storage inverts most of those mechanics.
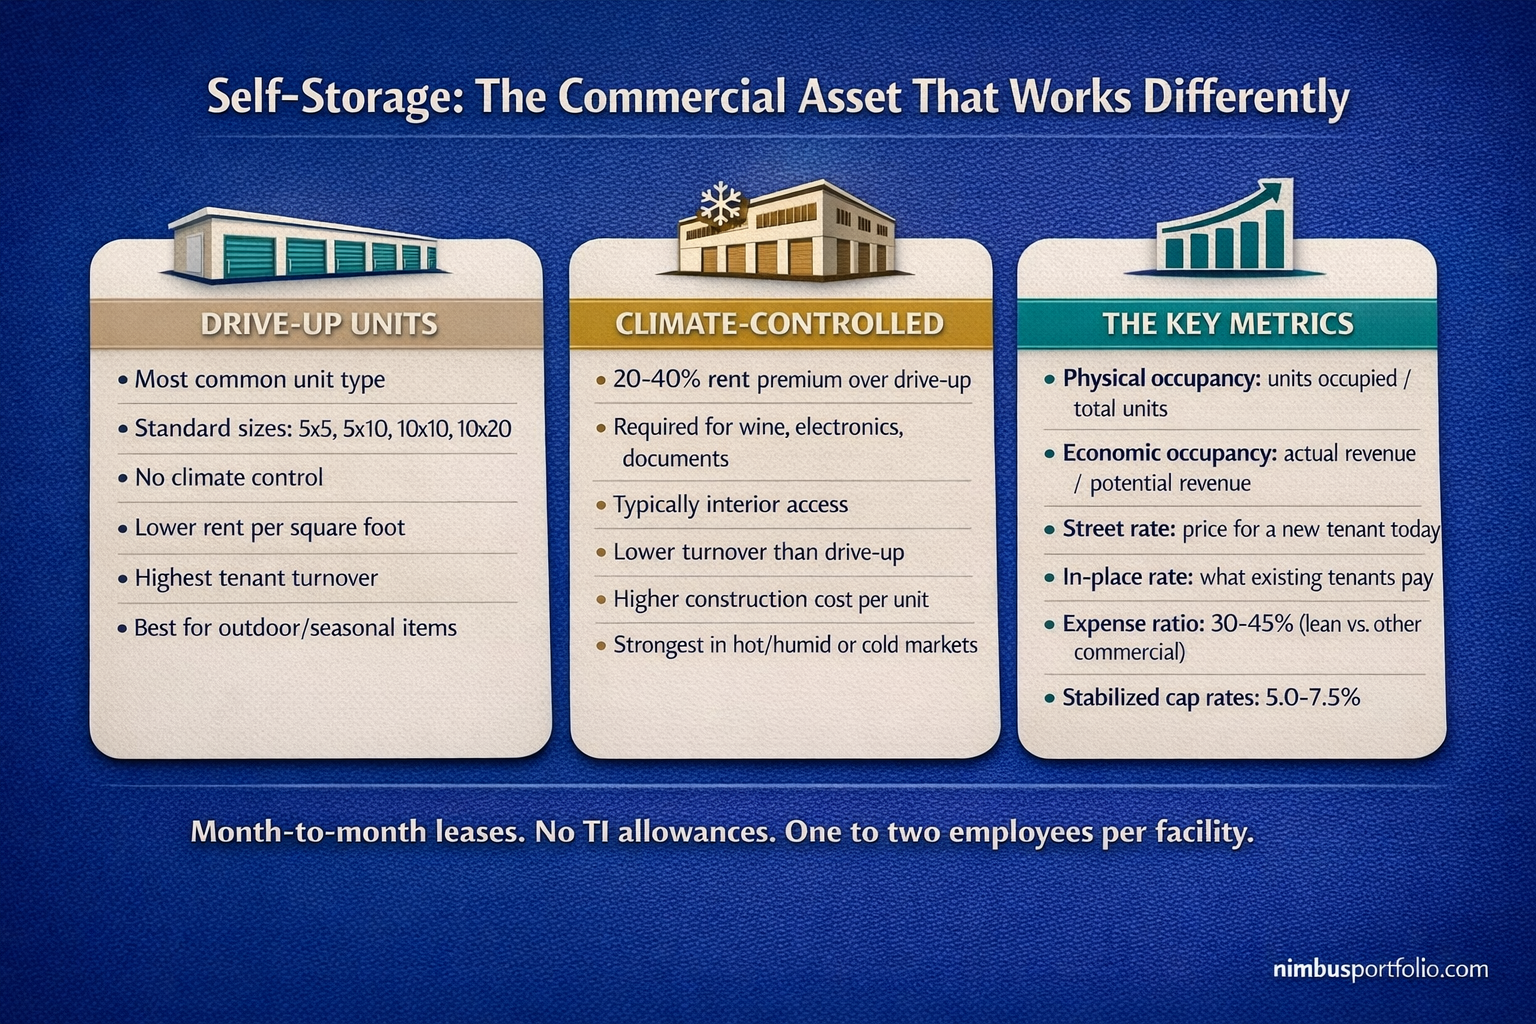
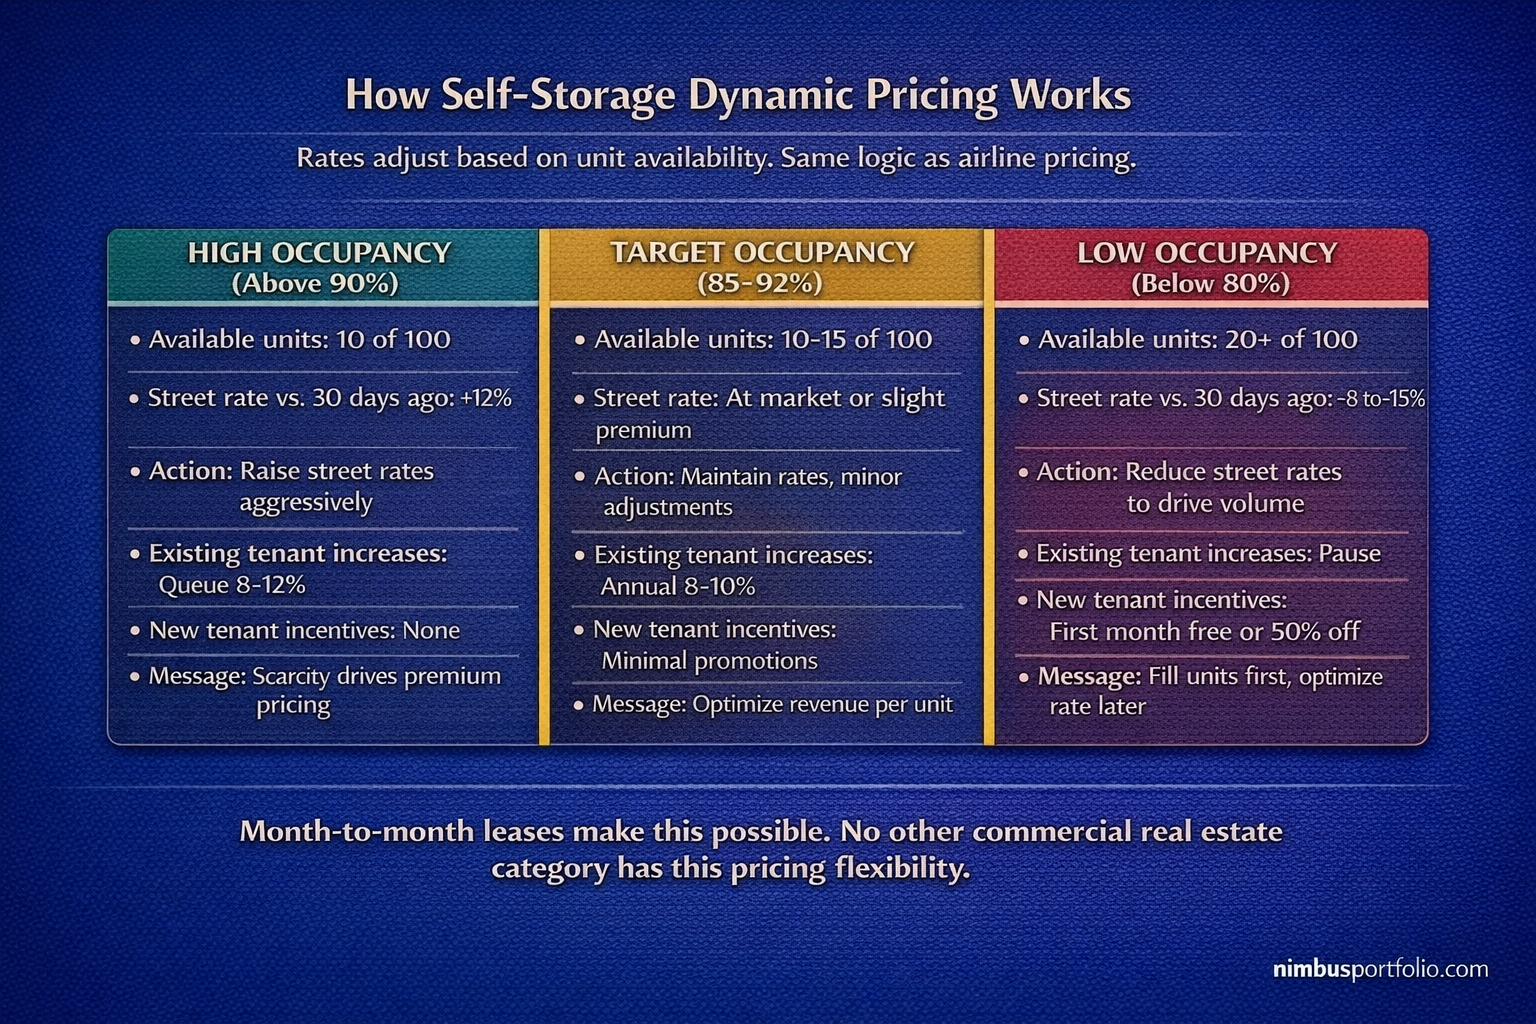
The leases are month-to-month. Not 5-year commercial leases. Not 12-month residential leases. Month-to-month rental agreements with 30-day exit rights. That sounds like maximum landlord risk. In practice, it produces something more useful: maximum pricing flexibility. Because every tenant's rate can be adjusted at 30 days notice, a self-storage operator can respond to market conditions, raise rates on tenants who have been in place for years, and use revenue management software to adjust street rates daily based on occupancy thresholds. The month-to-month structure that looks risky is the mechanism that enables dynamic pricing.
There are no tenant improvement allowances. A 10x10 drive-up unit is a 10x10 drive-up unit. No buildout. No customization. No landlord capital required to turn over a vacated unit. The tenant removes their belongings, and the unit is immediately available for the next customer. This eliminates one of the most significant hidden costs in every other commercial real estate category.
The demand drivers are different from any other asset class. Self-storage demand is driven by life events, not economic cycles in the way retail or office are. Moves. Downsizing. Divorce. Death. Military deployment. College transitions. Business inventory overflow. These events happen in every economic environment. Storage is not recession-proof, but it is significantly more recession-resistant than most commercial categories. During the 2008-2009 recession, self-storage was one of the first commercial real estate sectors to recover occupancy because people who lost homes still needed somewhere to store their belongings while they transitioned.
The operating expense structure is structurally lean. A 400-unit self-storage facility typically operates with one to two full-time employees. There are no toilets to fix, no kitchens to update, no HVAC units inside individual units. Common area maintenance is minimal. Insurance is proportionally lower than apartment buildings. The expense ratio for a well-run storage facility runs 30-45% of gross revenue, compared to 45-55% for residential multifamily and 35-65% for commercial depending on lease structure. Lower expense ratios mean more of the top-line revenue reaches NOI.
Strategy 1: Stabilized Facility Acquisition
What it is: Buying an existing self-storage facility that is already operating at or near stabilized occupancy, typically 85-95% physical occupancy, with an established customer base and a track record of revenue and expenses. This is the lowest-risk entry into self-storage and the most common strategy for first-time storage investors.
Real example: A 350-unit self-storage facility in a suburban market outside Nashville. Mix of units: 120 drive-up 10x10 units at $95/month, 80 drive-up 10x20 units at $145/month, 100 climate-controlled 10x10 units at $120/month, 50 climate-controlled 10x15 units at $150/month. Current physical occupancy: 91%. Gross potential revenue at full occupancy: $528,600/year. Actual collected revenue at 91% physical occupancy and slight economic occupancy discount from concessions: $467,000/year.
Operating expenses: manager salary and part-time staffing ($62,000), property management software and revenue management platform ($8,400), property taxes and insurance ($38,000), maintenance and repairs ($14,000), utilities ($12,000), marketing ($8,000). Total operating expenses: $142,400. NOI: $324,600. Expense ratio: 30.5%.
Purchase price at a 6.0% cap rate: $5,410,000. Financed with a commercial loan at 6.75% fixed for 10 years, 25-year amortization, 30% down ($1,623,000). Annual debt service: approximately $285,000. Annual cash flow: approximately $39,600. Cash-on-cash return: 2.4%.
That cash-on-cash return looks thin. Two things explain why stabilized storage still attracts buyers at these prices. First, the in-place rents in this example are likely below current market street rates for tenants who have been renting for two or more years. As those tenants cycle, replacement tenants come in at current market rates. Second, storage values have appreciated significantly in markets where new supply is constrained. Investors underwriting stabilized storage are often buying the rent growth and appreciation thesis as much as current yield.
Physical occupancy vs. economic occupancy: Physical occupancy counts how many units have a tenant. Economic occupancy measures how much of the potential revenue you are actually collecting. A 91% physically occupied facility might have 88% economic occupancy after accounting for move-in specials, first month free promotions, and delinquent accounts. Underwriting on physical occupancy without checking economic occupancy overstates effective income.
In-place rates vs. street rates: Existing tenants often pay rates set 2-3 years ago. Street rates (what a new tenant pays today) may be 15-25% higher. When you acquire a stabilized facility, part of the value-add is pushing existing tenant rates toward market through annual increases of 8-12%. Tenants on month-to-month agreements have limited negotiating leverage. Most accept rate increases because the friction of moving their belongings exceeds the cost difference.
Metrics that matter:
- Physical and economic occupancy, not just physical.
- Street rate vs. in-place rate gap. Larger gaps mean more embedded rate growth potential.
- Expense ratio. Above 45% deserves explanation. Below 30% deserves skepticism.
- Revenue per occupied square foot. Allows apples-to-apples comparison across facilities with different unit mixes.
- DSCR at acquisition. Commercial storage lenders typically require 1.25x minimum.
Management intensity: Low to moderate with a local manager on-site or on-call. Revenue management software like Sitelink or StorEdge automates rate adjustments and tenant billing. The investor's primary role is capital decisions, vendor oversight, and monitoring key performance metrics monthly.
Best for: First-time self-storage investors, investors 1031 exchanging out of residential or commercial properties, and capital-preservation buyers who want lower operational complexity than residential multifamily.
Strategy 2: Lease-Up Facility Acquisition
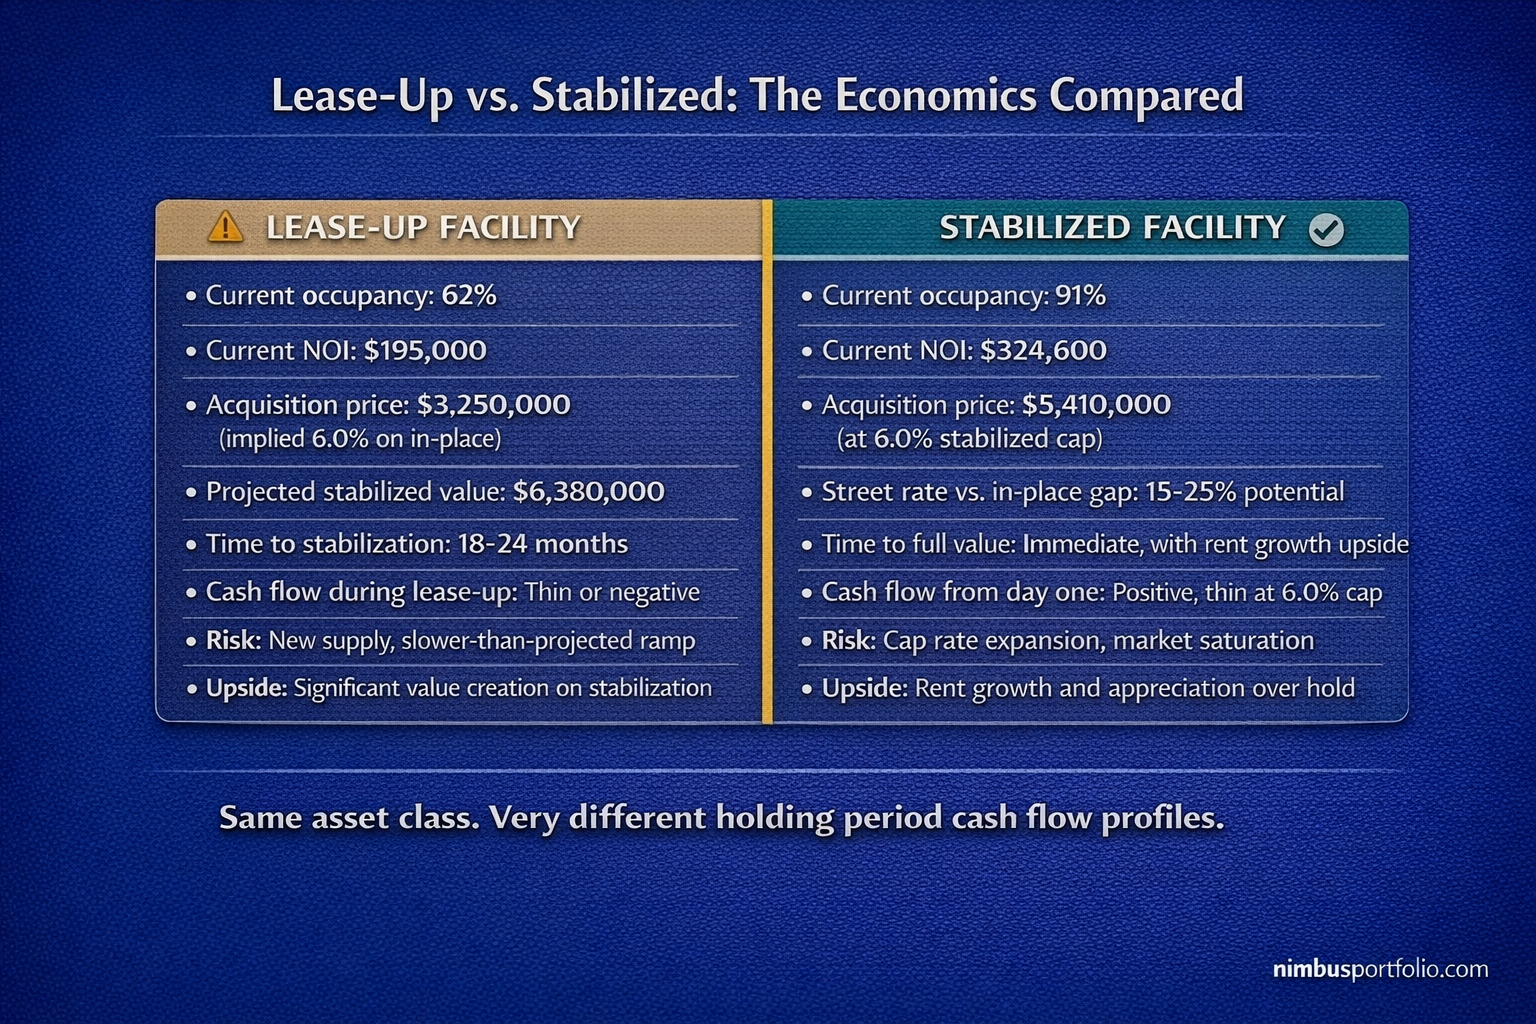
What it is: Buying a recently developed or recently expanded self-storage facility that has not yet reached stabilized occupancy, typically 40-75% physical occupancy. The investment thesis is acquiring below stabilized value today and holding through lease-up, allowing natural market demand to fill units over 18-36 months and then either refinancing on stabilized NOI or selling at stabilized cap rates.
Real example: A newly completed 400-unit self-storage facility in a growing suburban market, developed 14 months ago. Current physical occupancy: 62%. Gross potential revenue at full occupancy: $612,000/year. Current actual revenue: $356,000/year (at 62% occupancy with street rate discounts for new tenants). Current NOI: approximately $195,000 after operating expenses of $161,000 (expenses are nearly fixed regardless of occupancy during lease-up).
Seller pricing: $3,250,000, which reflects roughly a 6.0% cap on current in-place NOI with a lease-up discount applied. A stabilized buyer would pay $612,000 times 0.88 economic occupancy times a 35% expense ratio to get stabilized NOI of approximately $351,000, then apply a 5.5% stabilized cap rate to reach a stabilized value of approximately $6,380,000.
The gap between the acquisition price ($3,250,000) and the projected stabilized value ($6,380,000) is the lease-up opportunity. The investor holds through the 18-24 month lease-up period, investing capital for operations and debt service during the cash-flow-light period, and captures the value creation as occupancy normalizes.
The carry cost problem: During lease-up, the facility is not generating enough income to cover debt service. An investor who purchases a lease-up facility with 30% down and a standard commercial loan at 6.75% on a $3,250,000 purchase faces annual debt service of approximately $172,000 against current NOI of $195,000. The cushion is thin. Any slower-than-projected lease-up, new competitor opening, or market softening reduces it further. Lease-up acquisitions require adequate reserves and realistic occupancy ramp projections, not optimistic ones.
What drives lease-up speed: Proximity to residential density, daytime traffic counts, street visibility, and the competitive supply environment all affect how quickly a facility fills. A storage facility visible from a high-traffic retail corridor in a growing suburb fills faster than an identical facility on a secondary road with no signage visibility. Online listing presence on Google, Yelp, and storage-specific aggregator sites is the primary marketing channel. Facilities that invest in digital marketing during lease-up fill faster than those relying on signage alone.
Metrics that matter:
- Projected months to stabilization and the occupancy ramp assumptions behind that projection. Get competitive.
- Break-even occupancy: the occupancy percentage at which the facility covers all operating expenses and debt service. Know this number before you close.
- Reserve capital available to fund the carry period. Model the worst case: lease-up takes 36 months instead of 24.
- New supply pipeline in the submarket. A lease-up facility in a market where three competitors are under construction is a materially different risk than one in a supply-constrained submarket.
Management intensity: Moderate to high during lease-up. Active marketing, promotional pricing strategy, and weekly monitoring of occupancy by unit type require owner involvement. Post-stabilization, management intensity drops significantly.
Best for: Investors with adequate reserves, commercial real estate experience, and a high conviction on a specific submarket's demand trajectory. Not appropriate as a first real estate investment. The reward is significant if the underwriting is right. The penalty for poor market selection or optimistic lease-up assumptions is an extended period of negative cash flow.
Strategy 3: Value-Add Acquisition
What it is: Buying an underperforming or undermanaged self-storage facility and improving its performance through operational upgrades, physical improvements, or unit mix optimization. This is the most common strategy for experienced storage investors and the one most likely to produce strong risk-adjusted returns because the improvement levers are well-defined and relatively low cost compared to other commercial asset types.
Real example: A 280-unit mom-and-pop storage facility in a growing suburb. The owners have operated it for 20 years without revenue management software, raising rates only when tenants complained they were too cheap. Current average rate: $78/month per unit. Market street rate for comparable units in the submarket: $105/month. Physical occupancy: 94%, but economic occupancy is only 81% because of delinquent accounts and units being held for non-paying tenants who have not been formally liened and auctioned. No climate-controlled units despite being in a humid Southern market. No digital marketing presence. Facility is rented entirely through signage and word of mouth.
Purchase price: $2,100,000 at a current NOI of approximately $147,000 (7.0% cap). The price reflects the underperformance, not the potential.
Year 1 improvements: implement revenue management software ($8,400/year), clear the delinquency backlog through proper lien law procedures (takes 90-120 days), launch Google Business profile and storage aggregator listings ($4,000 one-time setup plus $800/month in advertising). Rate increases of 12-18% on in-place tenants over a 12-month period, starting with longest-tenured tenants who are furthest below market.
Year 2-3 improvements: convert one drive-up row (40 units) to climate-controlled interior units at a conversion cost of approximately $180,000. Premium: $115/month for 10x10 climate-controlled versus $88/month for drive-up. The additional rent on 40 converted units at 90% occupancy: roughly $97,200/year. The capital cost: $180,000. Payback period on the conversion alone: 22 months.
Stabilized NOI projection after all improvements: approximately $295,000. At a 5.75% exit cap rate (tighter than the acquisition cap because the facility is now better managed): value of $5,130,000 on a total investment of approximately $2,280,000 (purchase plus improvements). That is a 2.25x equity multiple before accounting for cash flow during the hold period.
The mom-and-pop premium: Self-storage is uniquely fragmented compared to other commercial asset classes. Thousands of facilities across the country are still operated by individual families who built them 20-30 years ago and run them with paper ledgers, below-market rates, and no digital presence. These operators are not unsophisticated. They simply have not adopted the tools that modern storage operators use as table stakes. The gap between their performance and what a competent operator achieves with the same physical asset is the value-add opportunity.
Ancillary revenue: Well-run storage facilities generate income beyond unit rent. Truck rentals (a formal partnership with a rental company or an informal arrangement for on-site trucks) add $15,000-$40,000/year for a midsize facility. Tenant insurance programs, where the operator earns a referral commission on policies sold to renters, add $8,000-$20,000/year. Moving supply sales (boxes, tape, locks) are modest but add to the customer experience and generate incremental margin. These revenue streams are often absent entirely in mom-and-pop operations.
Metrics that matter:
- Street rate vs. in-place rate gap. Wider gaps mean more embedded revenue without adding a single unit.
- Economic occupancy relative to physical occupancy. A large gap signals delinquency or management problems, both of which are fixable.
- Revenue per square foot vs. submarket competitors. This normalizes across different unit mixes.
- Capital cost of climate conversion per unit vs. rent premium achieved. The return on this specific investment is calculable before you close.
- Cash-on-cash return at acquisition NOI vs. projected stabilized NOI. The spread is the value-add thesis in a single number.
Management intensity: High during the improvement phase. Clearing delinquency, implementing new systems, training staff, and managing construction for climate conversion all require active owner or operator involvement. Post-stabilization, intensity drops to the same level as a stabilized acquisition.
Best for: Investors with operational experience or a strong operating partner, and the reserves to fund improvements and any short-term occupancy disruption from rate increases. The value-add self-storage play has produced some of the strongest risk-adjusted returns in commercial real estate over the past decade, precisely because the operational improvements are tangible, measurable, and replicable.
Strategy 4: Ground-Up Development or Conversion
What it is: Building a new self-storage facility from the ground up, or converting an existing structure (former retail, warehouse, or industrial building) into self-storage. This strategy produces the highest projected returns and carries the highest execution risk. It requires navigating zoning, construction, and a lease-up period simultaneously.
Real example: A 5-acre site in a growing suburban market acquired for $650,000. Zoning permits self-storage with a conditional use permit. Development plan: 500 units across two buildings, mixing drive-up and climate-controlled units, with a total gross leasable area of 62,000 square feet. Total development cost including land, construction, soft costs, and pre-opening operating reserves: $5,800,000. Projected stabilized gross revenue at 88% occupancy: $892,000/year. Projected stabilized NOI at a 38% expense ratio: $553,000. Projected stabilized value at a 5.5% cap rate: $10,055,000.
Development-to-stabilized spread: $10,055,000 projected value versus $5,800,000 total cost. That 73% margin sounds compelling. The actual investment experience between signing the purchase contract on the land and depositing a stabilized refinance check is 36-54 months of zoning risk, construction delays, budget overruns, and lease-up uncertainty. Every assumption in the development pro forma has a range of outcomes. When they compound in the wrong direction simultaneously, a $10 million projected value becomes a $7 million realized value and a 4-year development period becomes a 6-year period.
Conversion as a lower-risk development alternative: Converting a vacant retail building or warehouse into self-storage is faster than ground-up, often less expensive, and sidesteps some zoning challenges because an existing commercial structure already has entitlements. A 40,000 square foot former strip retail building with a large parking lot converts well: the parking becomes drive-up unit access lanes and the existing building envelope becomes climate-controlled interior units. Conversion costs run $25-$45/sf versus $65-$90/sf for ground-up construction. The lease-up risk remains, but the execution risk is lower.
Zoning is the first filter: Self-storage is not universally welcomed in every zoning district. Many municipalities restrict storage to industrial or highway commercial zones. Some have imposed moratoriums on new storage development in saturated markets. The first question for any development or conversion play is whether the site is properly zoned or can be rezoned with reasonable probability. Conditional use permits involve public hearings, neighbor objections, and timeline uncertainty. Underestimating this step is among the most common development planning errors.
Metrics that matter:
- Development cost per unit relative to the projected stabilized rent per unit. If you are spending $11,600/unit to build and the market rents a comparable unit for $95/month, you are at a 10.2 year gross rent payback before operating expenses. That math only works if the stabilized value is significantly above the development cost.
- Projected NOI vs. development cost (yield on cost). Target 7-8% yield on cost for ground-up to justify the risk over buying stabilized assets.
- Submarket supply pipeline. Are other developers building within your trade area? Opening into a market with three new competitors under construction changes the lease-up assumption.
- Zoning timeline risk. Model a 6-month delay on every entitlement process and stress-test the impact on total project returns.
Management intensity: Very high during development. Land entitlement, design, permitting, construction management, pre-marketing, and lease-up management are all active processes requiring ongoing decisions. Post-stabilization, the asset operates like any other storage facility.
Best for: Experienced commercial real estate developers or investors partnering with experienced developers. Not a first-deal strategy. Development returns are highest when the execution risk is managed by a team that has done it before.
Strategy 5: Third-Party Management and Aggregation
What it is: Owning multiple smaller self-storage facilities and using a professional third-party management company to operate all of them under a single platform, achieving economies of scale in marketing, software, staffing, and purchasing. Alternatively, acquiring a portfolio of smaller facilities from multiple individual sellers and consolidating them under unified management, creating value through operational efficiency rather than physical improvements.
Real example: An investor acquires three separate mom-and-pop storage facilities in a regional market over a 24-month period: a 150-unit facility for $1,100,000, a 200-unit facility for $1,650,000, and a 175-unit facility for $1,400,000. Total portfolio acquisition cost: $4,150,000. All three are signed to a regional third-party management company that charges 6-8% of gross revenue in exchange for handling all staffing, software, revenue management, marketing, maintenance coordination, and reporting.
Combined gross potential revenue across all three: $618,000/year at stabilized occupancy. Combined actual collected revenue: $537,000 (87% average occupancy across the portfolio). Combined expenses: $200,000 including management fees, taxes, insurance, and maintenance. Combined portfolio NOI: $337,000. Cash-on-cash return on total equity invested (30% down on each): approximately 9.1%.
The consolidation play: once all three facilities are on the same revenue management platform with unified marketing and consistent pricing discipline, the operator raises rates toward market across all three, eliminates the management inefficiencies of family-run operations, and layers in ancillary revenue streams (tenant insurance, truck rentals). The projected stabilized portfolio NOI at full optimization: $420,000. At a 5.75% cap rate, the portfolio value is $7,304,000 on a $4,150,000 acquisition cost plus a roughly $500,000 down payment differential (30% down across all three was approximately $1,245,000 in equity).
Why REIT consolidation creates opportunity for individual investors: The major self-storage REITs (Public Storage, Extra Space Storage, CubeSmart, Life Storage) have systematically acquired stabilized, well-located facilities over the past 20 years. They are not buying 150-unit facilities in secondary markets. Their acquisition thresholds favor facilities with 400+ units in primary and secondary markets. This leaves a large segment of the market, smaller facilities in suburban and tertiary markets, underserved by institutional capital and available to individual investors at pricing that reflects their current management quality rather than their potential.
Third-party management economics: A 6-8% management fee on a facility generating $180,000/year in gross revenue is $10,800-$14,400/year. That is a fraction of the cost of a full-time employee, and the management company brings software, systems, marketing relationships, and revenue management expertise that a self-managed small operator often lacks. For investors who do not want to operate personally, third-party management is the path to owning storage without becoming a storage operator.
Metrics that matter:
- Management fee structure and what it includes. Some third-party operators charge separately for software, marketing, and maintenance coordination above the base percentage. Know the all-in cost.
- Reference checks on the management company. Their performance on your facility depends on staff quality, systems, and how many facilities they are managing simultaneously. Overstretched operators underperform.
- Geographic clustering. Facilities that are close enough to share a manager or share vendor relationships reduce operating costs and management complexity.
- Portfolio NOI vs. individual facility NOI. The aggregation creates value only if unified management actually improves performance, not just on paper.
Management intensity: Low for the investor, high for the management company. The investor's role is capital allocation, portfolio-level performance monitoring, and lender relationship management. The management company handles operations.
Best for: Investors who want self-storage exposure across multiple assets with passive income characteristics, portfolio diversification within the asset class, and eventual institutional exit optionality. A portfolio of three to five well-located facilities under unified management is an attractive acquisition target for regional REITs and large private storage operators.
Why the Numbers Work Differently in Self-Storage
Parts 1 through 5 built the NOI-based valuation framework and then applied it across asset classes that each add their own complexity. Self-storage applies the same framework, but the levers that move NOI are different from anything covered so far.
The expense ratio advantage is real and durable. A 200-unit apartment building requires a maintenance team, responsive 24-hour emergency service, and ongoing unit turnover costs between tenants (paint, cleaning, appliance repairs). A 200-unit self-storage facility requires one manager, a monthly pest control contract, and occasional door spring replacements. The structural difference in operating costs is why well-run storage consistently produces NOI margins of 55-70% of gross revenue, compared to 45-55% for residential multifamily.
Revenue management software changed the economics. Before storage-specific software platforms existed, operators raised rates once a year by a flat percentage if they remembered to. Modern revenue management platforms adjust street rates daily based on occupancy by unit type, competitive market data, and demand signals. A 10x10 drive-up unit at 95% occupancy and a 10x20 drive-up unit at 72% occupancy get different pricing treatments simultaneously. This is not a feature available to apartment operators or retail landlords. Month-to-month leases are the prerequisite.
The demand drivers are recession-resistant, not recession-proof. Life events create storage demand: moves, divorces, downsizing, deaths, deployments. These events happen in recessions. They also happen when consumer confidence is low and people are consolidating housing. What does slow storage demand is new competition opening nearby. The primary risk in self-storage is not economic cycles. It is new supply entering your submarket before you reach stabilized occupancy.
Self-storage has experienced significant cap rate compression. Facilities that traded at 8-9% cap rates in 2012 trade at 5-6.5% cap rates in 2025-2026. That compression reflects institutional capital recognizing the asset class's operating characteristics. The compression creates a challenge for new buyers: stabilized returns at current cap rates are modest without rent growth and appreciation assumptions. Investors buying storage today are making a bet on continued demand, supply constraints, and their ability to push NOI higher over the hold period. That bet has historically been rewarded in supply-constrained markets and has not worked out well in oversupplied ones.
The financing landscape: Self-storage is treated as commercial real estate by lenders. Expect 25-30% down payments, 5-10 year fixed terms with balloon payments, and DSCR requirements of 1.25-1.35x. SBA loans are available for owner-operators purchasing smaller facilities under $5 million. Bridge loans are common for lease-up and value-add acquisitions where the current NOI would not support permanent financing. Understanding how your leverage ratio affects your total return picture matters here as much as in any other commercial category.
How Nimbus Handles This
A 350-unit self-storage facility does not fit into a residential property tracking tool, and it does not fit comfortably into a generic commercial template that was designed for triple-net retail. The metrics that matter for storage, physical occupancy, economic occupancy, revenue per square foot, NOI margin, and the gap between street rates and in-place rates, are specific to the asset class.
Nimbus Portfolio tracks self-storage facilities at the asset level with the performance metrics that matter to storage operators and investors. You can log the facility's unit count, unit mix, and revenue figures, monitor NOI, cap rate, cash-on-cash return, DSCR, and equity position over time, and see monthly valuation snapshots that reflect how the facility's performance is translating to estimated asset value.
The portfolio view is where things get genuinely useful for mixed-asset investors. If you own two single family rentals, a duplex, and a 200-unit storage facility, Nimbus rolls all four into a single dashboard: total portfolio value, total equity, total monthly cash flow, and asset allocation by type. The storage facility's NOI-based value sits alongside your residential cash flow assets in the same view, at the same time, without requiring you to maintain four separate spreadsheets. See how a mixed portfolio looks from a single view.
Scenario modeling is available at the storage facility level. Model what happens to your returns if you convert 40 drive-up units to climate-controlled. Run a stress test on occupancy dropping from 91% to 78%. Analyze hold vs. exit as cap rates shift. The buy scenario tool, DSCR calculator, and cash-on-cash calculator are all free and require no account.
What Comes Next in This Series
This is Part 6 of a 16-week series. Next up: mobile home parks. Storage is often described as the simplest commercial real estate asset class to understand. Mobile home parks are described as the most misunderstood. They share some characteristics with storage (low operating expenses, high tenant retention) and have almost nothing in common with residential multifamily. The distinction between owning the land and owning the homes on it changes the entire risk and return equation. That is what Part 7 covers.
Start Tracking Your Storage Facility the Way Its Performance Demands
A 350-unit self-storage facility is not a rental property with extra units. It is a commercial asset whose value responds to occupancy dynamics, revenue management decisions, and the gap between your current rates and what the market will bear. Tracking it alongside your residential properties, or not tracking it at all, means losing visibility into the levers that actually move the number.
Add your first property in under two minutes and see your numbers the way they actually work. Get started at Nimbus Portfolio
Nimbus Portfolio tracks 19+ real estate asset types and categories. Free tier available. Portfolio plan at $24/month or $190/year. Portfolio+ at $49/month or $390/year.