Why Market Fundamentals Matter More Than Cap Rates (And How to Actually Use Them)
Two $400,000 rental properties in downtown Denver. Same purchase price. Same cash flow. Same cap rate: 6.5%.
Five years later, one investor gained $62,000 in equity. The other lost $2,800.
What happened?
Cap rate told them they were making the same investment. Market fundamentals told the truth.
The Problem: Cap Rate Is a Snapshot, Not a Film
Cap rate measures one thing: your first-year return based on net operating income divided by purchase price.
It's useful. But it's incomplete.
Cap rate doesn't show you:
- Whether values are rising or falling in that neighborhood
- If you're buying in an investor-driven market or a homeowner-driven market
- How the market has performed over the last five years
- Whether the current trend is accelerating or cooling
Cap rate is a snapshot. Market fundamentals are the film that shows you where the story is going.
Most investors skip the fundamentals because pulling data from multiple sources takes hours. The Federal Reserve publishes economic indicators. The Census Bureau tracks demographics. Zillow has market trends. County assessors have property records.
By the time you've compiled it all into a spreadsheet, you're exhausted—and you haven't even started analyzing.
So investors default to cap rate. It's easy. It's available. And it's misleading.
The Three Fundamentals That Actually Matter
If you want to know whether a property will build wealth, you need three data points:
1. Price-to-Rent Ratio
What it measures: The relationship between property values and rental income in a market.
Why it matters: Price-to-Rent Ratio tells you who's driving the market—investors or homeowners.
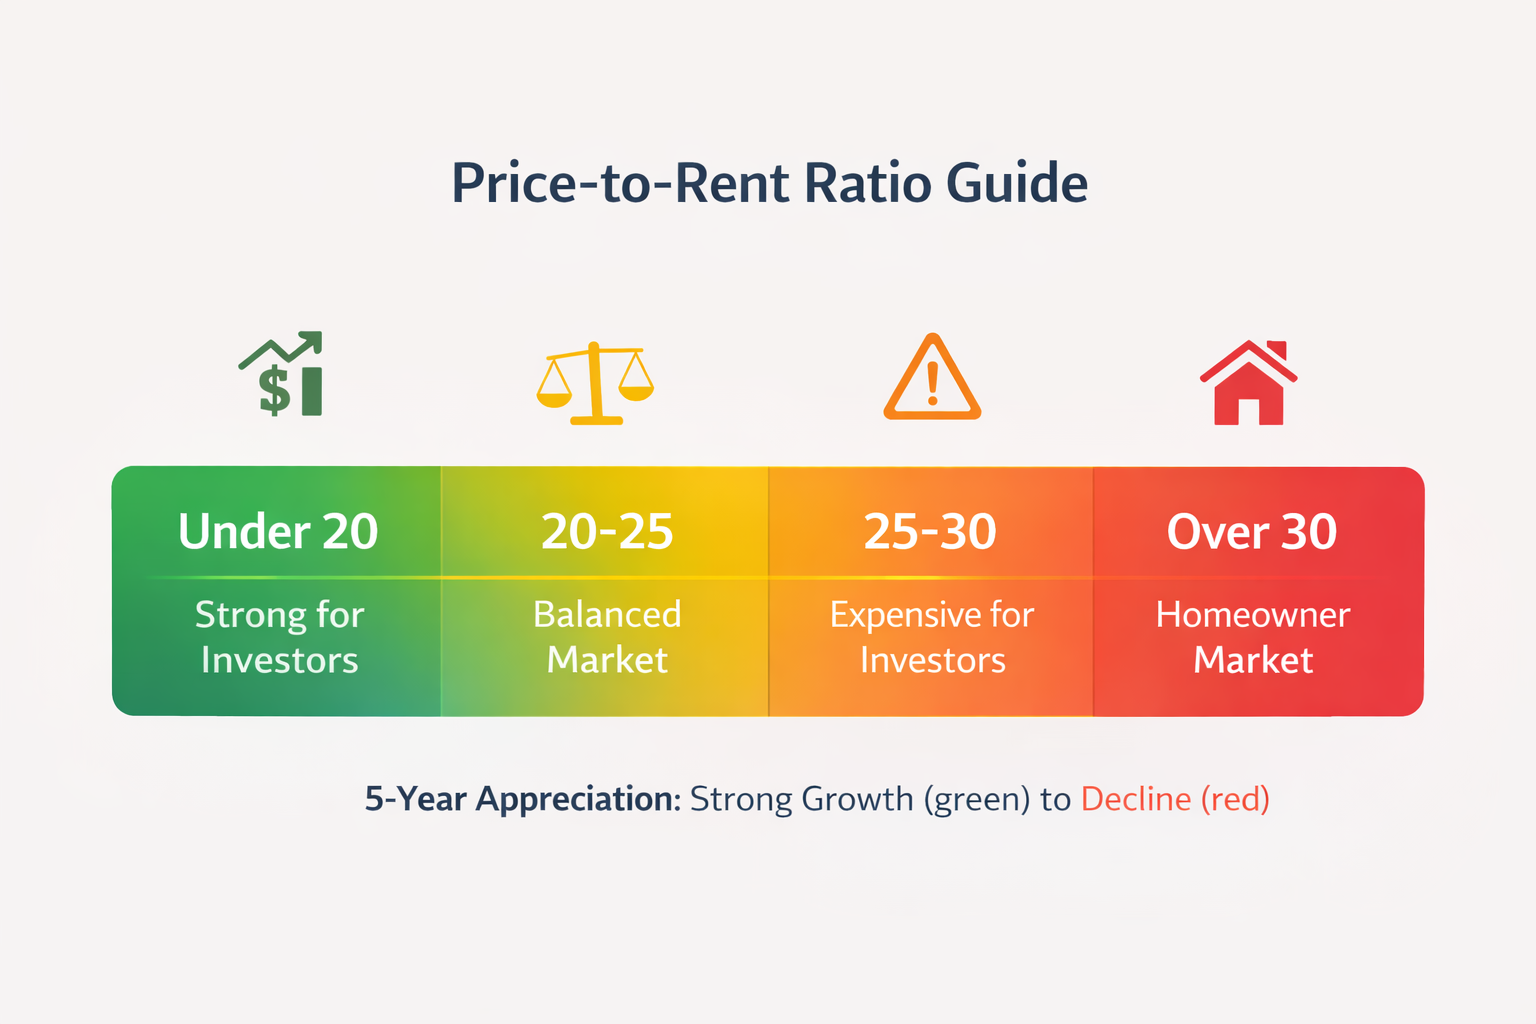
- Under 20: Strong investor market. Properties cash flow well. Investors are active buyers.
- 20-25: Balanced market. Mix of investors and homeowners.
- 25-30: Expensive for investors. You're competing with homeowners who can overpay.
- Over 30: Homeowner-driven market. Expect negative cash flow or barely break-even properties.
How to use it: If you're buying for cash flow, look for markets under 25. If you're buying for appreciation and can absorb negative cash flow, markets over 30 might work—but only if appreciation trends support it.
2. 5-Year Appreciation
What it measures: How much property values have grown (or declined) over the past five years.
Why it matters: 5-Year Appreciation shows whether the market has long-term momentum or if it's stagnant.
- Positive growth: The market is building wealth. Capital is flowing in.
- Negative growth: Values are declining. Capital is leaving.
- Strong growth (+10% or more): Best wealth-building potential, but verify it's sustainable.
How to use it: Strong 5-year appreciation with a reasonable Price-to-Rent Ratio (under 30) is your sweet spot. High appreciation with terrible cash flow only works if you have reserves to cover losses for years.
3. Year-over-Year Trends
What it measures: Whether values are currently rising or falling compared to the same period last year.
Why it matters: Year-over-Year (YoY) trends show current market direction. Compare this to 5-Year Appreciation to understand if the market is heating up, cooling down, or staying consistent.
- Positive YoY + Positive 5Y: Market momentum is strong and consistent.
- Negative YoY + Positive 5Y: Market is cooling but has long-term strength.
- Negative YoY + Negative 5Y: Market is declining and accelerating downward. Avoid.
How to use it: A negative YoY in a strong 5-year market might be temporary cooling—not a reason to panic. But negative YoY in a weak 5-year market is a structural decline.
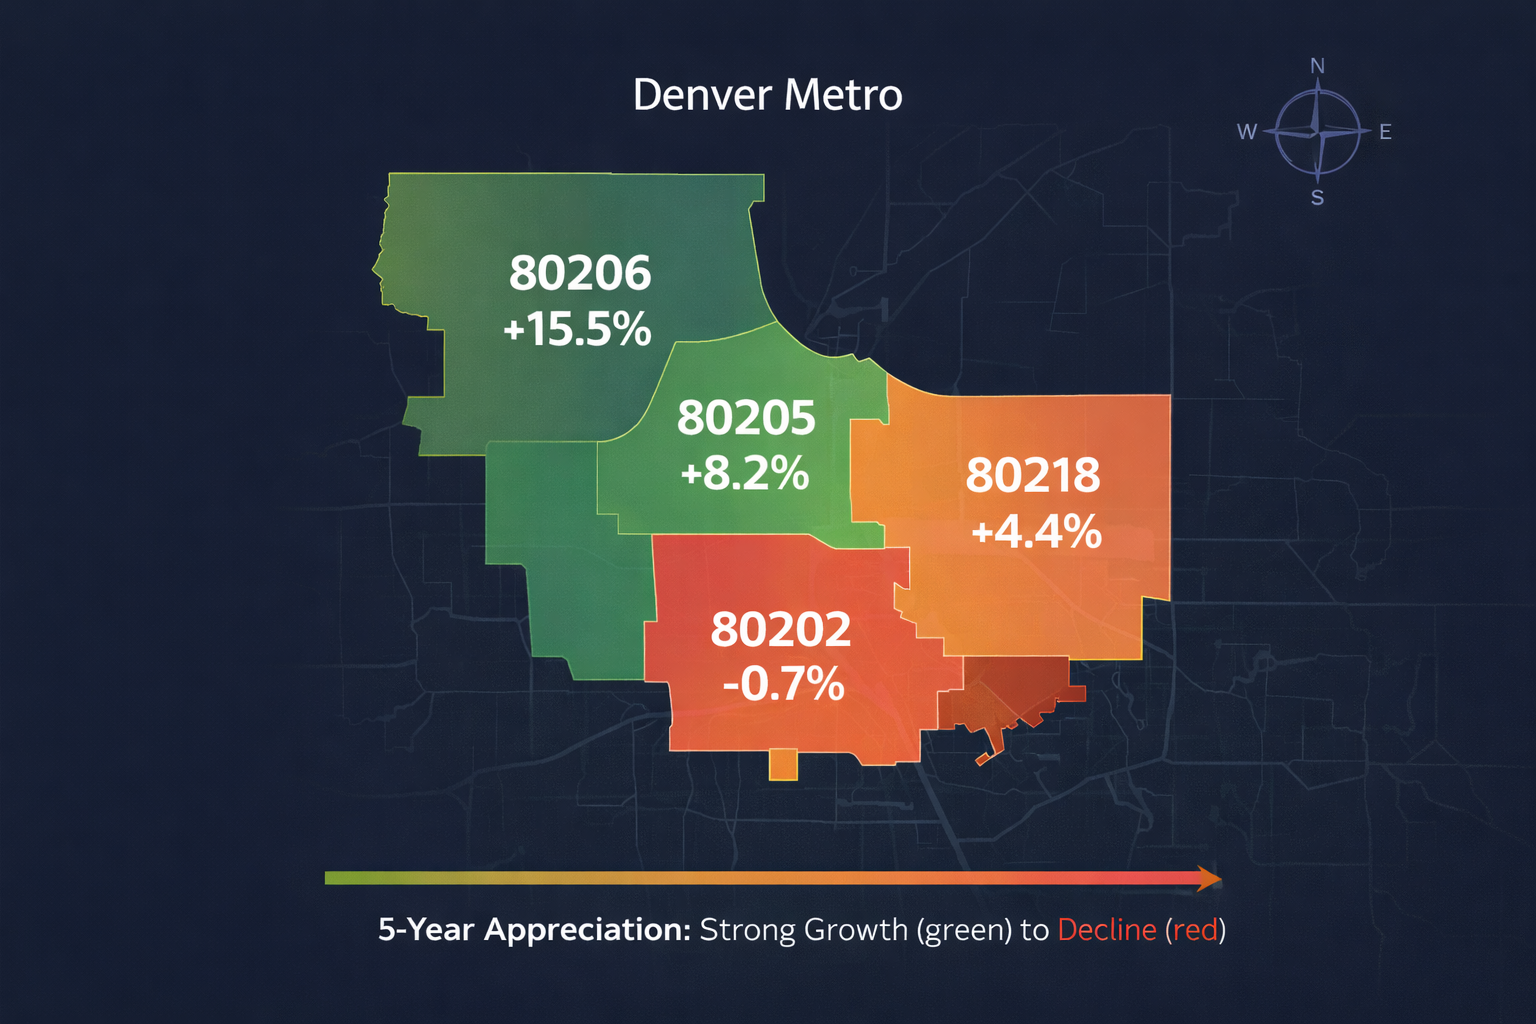
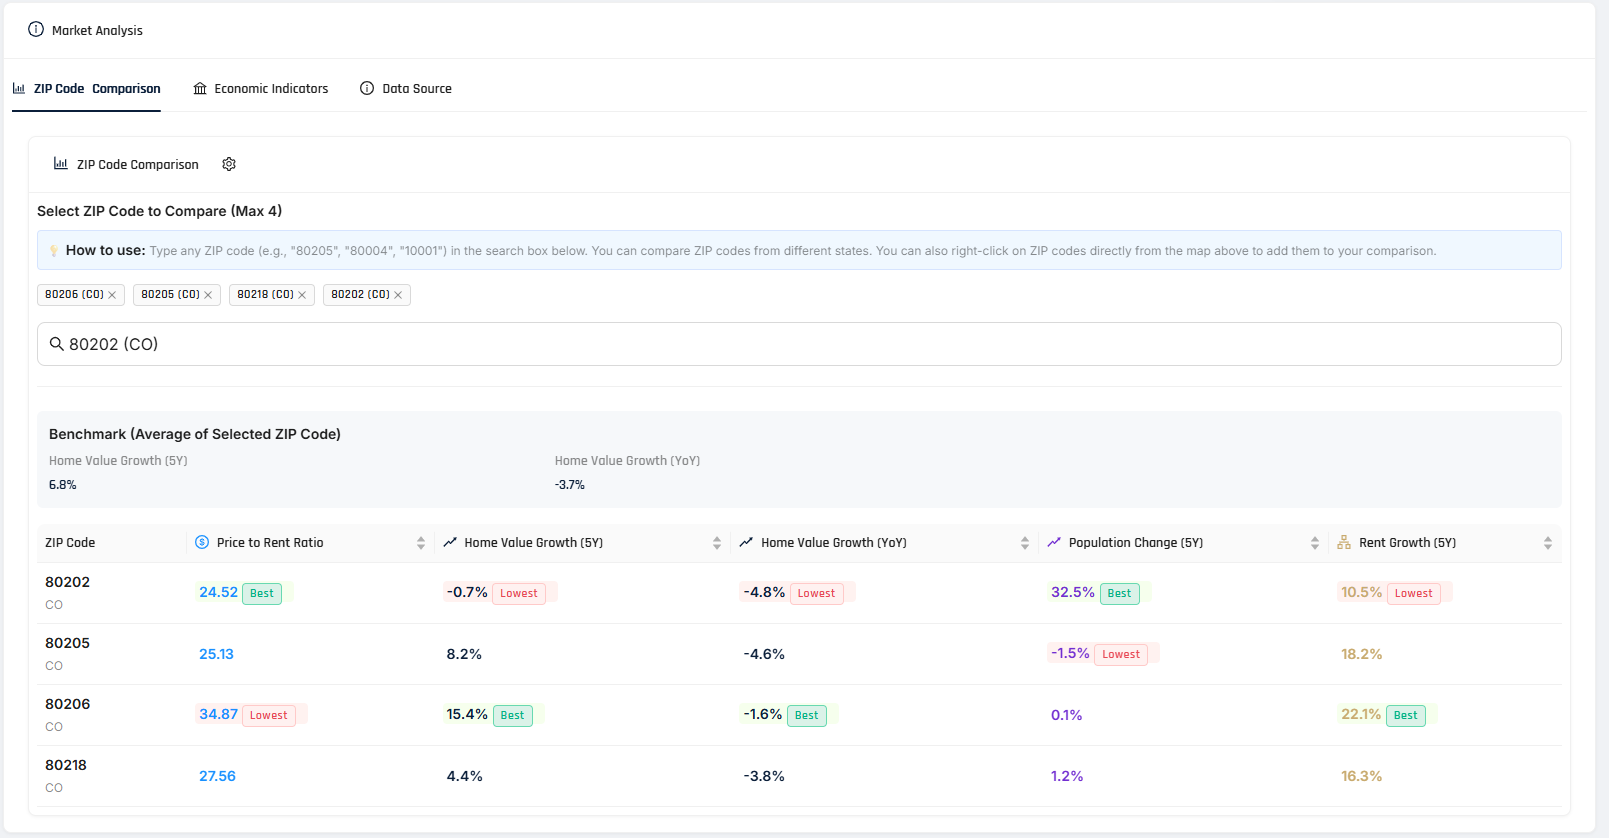
Real Example: Four Denver ZIP Codes, Four Different Outcomes
Let's look at four $400,000 properties in downtown Denver. All within 2 miles of each other. Same price point. But completely different fundamentals.
What happened here?
All four ZIP codes show negative year-over-year trends in late 2025. Denver's market is cooling after several hot years. But the magnitude and 5-year context reveal which ZIPs have temporary cooling versus structural decline.
80206 (City Park): Best Appreciation, Worst Cash Flow
- Price-to-Rent Ratio of 34.9 means this is a homeowner-driven market. You're competing with people who don't care about rental yield.
- 5-Year Appreciation of +15.5% is the strongest in this comparison. Long-term momentum is excellent.
- YoY of -1.6% shows the market is cooling, but not collapsing.
Decision: Only buy here if you can absorb negative cash flow for years while waiting for appreciation. If you need cash flow today, skip it.
80205 (Five Points): The Balanced Option
- Price-to-Rent Ratio of 25.1 is right at the edge of "balanced market." Cash flow is manageable.
- 5-Year Appreciation of +8.2% is solid. Not explosive, but consistent wealth-building.
- YoY of -4.6% is steeper than 80206, but the 5-year trend supports long-term strength.
Decision: This is the "sleep well at night" option. Reasonable cash flow, solid appreciation, balanced risk.
80218 (Capitol Hill): Weak Growth, Expensive
- Price-to-Rent Ratio of 27.6 is expensive for investors. Cash flow will be tight.
- 5-Year Appreciation of +4.4% is weak compared to neighboring ZIPs.
- YoY of -3.8% shows the market is cooling.
Decision: Not compelling. You're paying for a homeowner-driven market without the appreciation to justify it.
80202 (Downtown Core): The Loser
- Price-to-Rent Ratio of 24.5 looks reasonable on paper. But look deeper.
- 5-Year Appreciation of -0.7% means this ZIP code LOST value over five years.
- YoY of -4.8% shows the decline is accelerating.
Decision: Hard pass. Even if cash flow looks good, buying into a declining market means you're losing equity every year.
Why Investors Skip This
The biggest reason investors don't use market fundamentals is time.
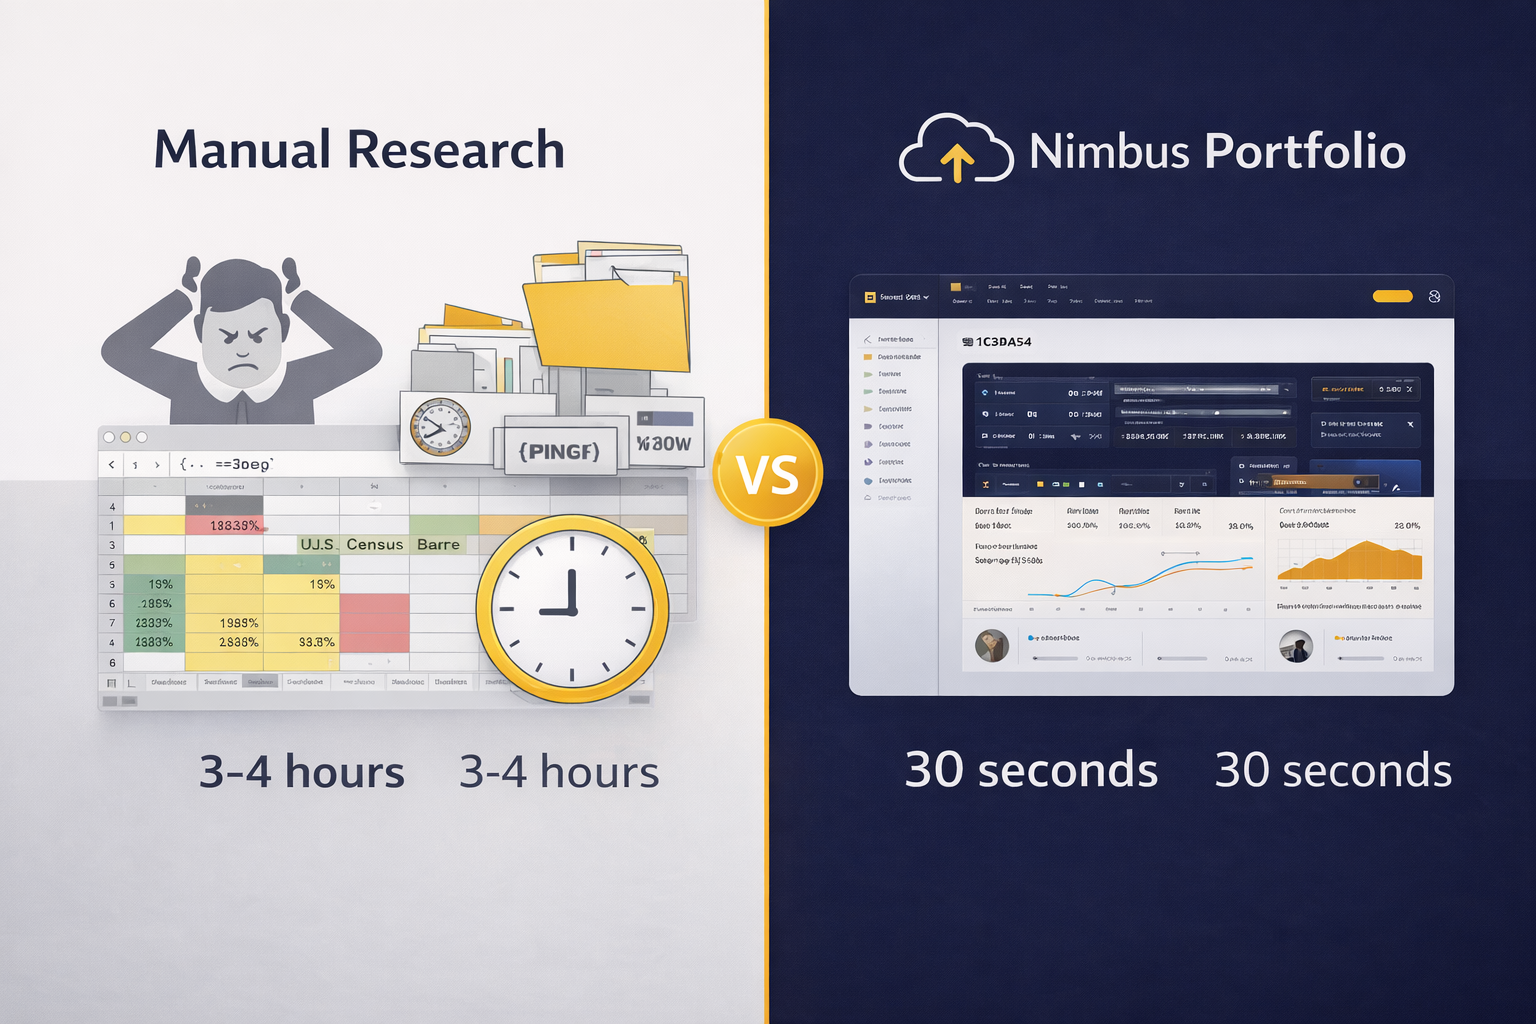
To get this data manually, you need to:
- Pull 5-year price trends from Zillow or Redfin
- Cross-reference rental data from Rentometer or local listings
- Calculate Price-to-Rent Ratio yourself
- Track YoY trends month by month
- Repeat this for every ZIP code you're considering
By the time you're done, you've spent 3-4 hours per market—and you still might have missed something.
So investors take shortcuts. They trust cap rate. They listen to headlines: "Denver is hot right now." They aggregate an entire metro into a single decision: "I should buy in Denver."
But Denver isn't one market. It's 87 different markets (one per ZIP code), each with distinct fundamentals.
Your ZIP code matters more than your city.
Clarity Over Clutter: How Nimbus Solves This
Nimbus Portfolio pre-calculates these fundamentals for every ZIP code in the U.S. using institutional-grade data from:
- Federal Reserve economic indicators
- U.S. Census Bureau demographics
- Zillow market trends
You get:
- Price-to-Rent Ratios updated monthly
- 5-Year Appreciation trends with historical context
- Year-over-Year changes to spot cooling or heating markets
- Side-by-side ZIP code comparisons in seconds
No spreadsheets. No manual data entry. No guessing.
Access the Market Intelligence Map for free →
How to Use This in Your Next Deal
Before you analyze cap rate, pull the fundamentals:
Step 1: Look up the ZIP code on Nimbus's Market Intelligence Map.
Step 2: Check the three fundamentals:
- Price-to-Rent Ratio: Can I cash flow here?
- 5-Year Appreciation: Is this market building wealth?
- YoY Trends: Is the market heating up or cooling down?
Step 3: Make your decision based on what the fundamentals show:
- Strong 5-year + reasonable P/R → Buy for wealth-building
- Weak 5-year + negative YoY → Walk away
- Mixed signals → Run a scenario to see if the deal still works in a downturn
Step 4: Use cap rate as a final check—not the starting point.
Final Thought
Cap rate tells you what you're earning today. Market fundamentals tell you whether that property will make you wealthier five years from now.
Most investors chase cap rate. Smart investors follow fundamentals.
Your ZIP code matters more than your city. Don't aggregate yourself into bad decisions.

Compare market fundamentals for any U.S. ZIP code →
About Nimbus Portfolio
Nimbus Portfolio helps real estate investors track 19+ asset types with institutional-grade market intelligence. From single-family rentals to billboards, land, and storage facilities—see your entire portfolio in one place with scenario modeling that shows you where your next dollar should go.